
June 17, 2026 a 01:00 pm

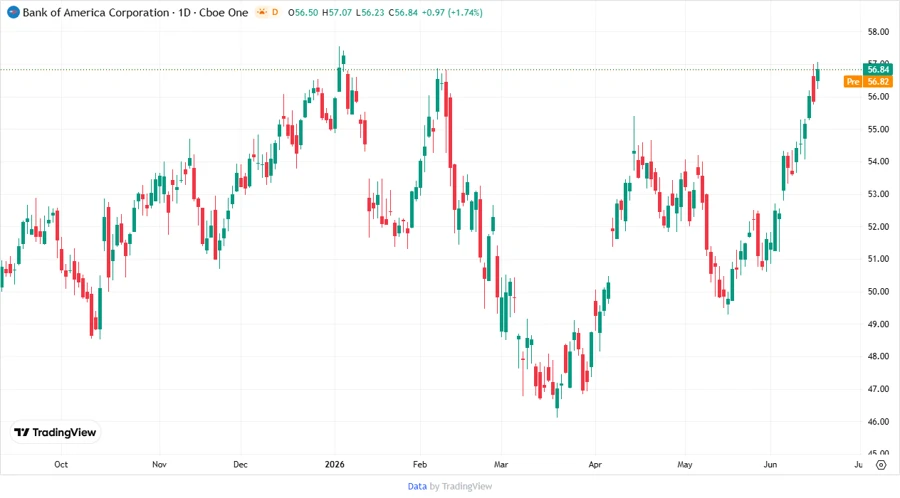
BAC: Fundamental Ratio Analysis - Bank of America Corporation
The Bank of America Corporation (BAC) presents a versatile portfolio, offering a comprehensive range of financial services worldwide. Despite its robust market position, recent fundamental ratings indicate moderate strengths underscored by specific areas that require attention. Investors should note the balanced approach with potential growth in targeted segments.
Fundamental Rating
The fundamental analysis provides insight into the operational efficiency and valuation metrics of Bank of America. Scores indicate stability with potential growth barriers.
| Category | Score | Visual Representation |
|---|---|---|
| Discounted Cash Flow | 1 | |
| Return On Equity | 3 | |
| Return On Assets | 3 | |
| Debt To Equity | 1 | |
| Price To Earnings | 2 | |
| Price To Book | 2 |
Historical Rating
The historical data reflect consistent maintaining of performance scores over recent times with minimal fluctuations.
| Date | Overall | DCF | ROE | ROA | Debt/Equity | P/E | P/B |
|---|---|---|---|---|---|---|---|
| 2026-06-16 | 2 | 1 | 3 | 3 | 1 | 2 | 2 |
| (Prior Date) | 0 | 1 | 3 | 3 | 1 | 2 | 2 |
Analyst Targets
Analyst targets reveal a positive sentiment towards BAC with expected notable price growth.
| High | Low | Median | Consensus |
|---|---|---|---|
| 71 | 50 | 61 | 61.13 |
Analyst Sentiment
Current analyst sentiment suggests a prevailing Buy stance, highlighting the stock’s potential.
| Recommendation | Count | Visual Representation |
|---|---|---|
| Strong Buy | 0 | |
| Buy | 36 | |
| Hold | 17 | |
| Sell | 1 | |
| Strong Sell | 0 |
Conclusion
The overall outlook on Bank of America Corporation remains moderately optimistic, marked by stable yet unexceptional fundamental scores. Analysts have a positive view of its potential growth, yet cautious acknowledgment of market challenges remains. While the immediate past ratings show consistency, the absence of significant improvement highlights areas for enhanced performance. Investors are advised to weigh growth forecasts against potential market volatility.
Smart Data Insight
Master the Perfect Entry & Exit for this Stock
Don't leave your profits to chance. Historically, this stock follows specific seasonal patterns that institutional traders use to maximize returns.
- ✅ Identify the "Golden Buying Window"
- ✅ Avoid high-risk correction cycles
- ✅ Backtested data from the last 20+ years