May 09, 2026 a 06:00 pm

BAC: Fundamental Ratio Analysis - Bank of America Corporation
Bank of America Corporation (BAC) is a major player in the financial services sector, known for its extensive range of banking and financial products. With a strong global presence, BAC serves millions of clients, offering both retail and institutional services. This analysis provides insights into BAC's current position and future potential.
Fundamental Rating
The BAC stock currently holds a B- rating, reflecting moderate potential with room for growth driven by steady earnings and balanced financials.
| Rating Category | Score | Score Visualization |
|---|---|---|
| Discounted Cash Flow | 1 | |
| Return on Equity | 3 | |
| Return on Assets | 3 | |
| Debt to Equity | 2 | |
| Price to Earnings | 3 | |
| Price to Book | 2 |
Historical Rating
Observing the historical data showcases a consistent scoring pattern, underlining the company's stable financial performance over time.
| Date | Overall | DCF | ROE | ROA | D/E | P/E | P/B |
|---|---|---|---|---|---|---|---|
| 2026-05-08 | 2 | 1 | 3 | 3 | 2 | 3 | 2 |
| Previous | 0 | 1 | 3 | 3 | 2 | 3 | 2 |
Analyst Price Targets
Analysts present optimistic projections for BAC, highlighting potential price growth with a consensus rating pointing to a Buy.
| High | Low | Median | Consensus |
|---|---|---|---|
| $71 | $50 | $61 | $61.13 |
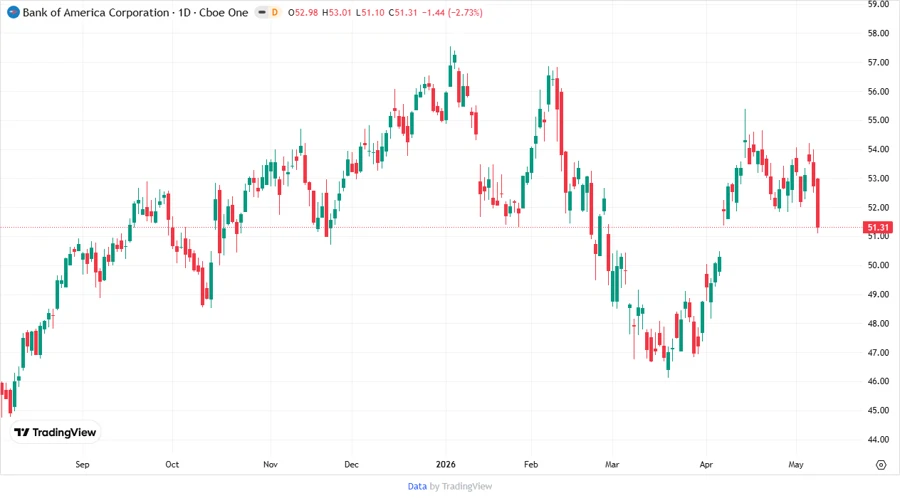
Chart detailing BAC stock performance
Analyst Sentiment
The majority of analysts maintain a Buy stance on BAC, consistent with the stock's stable and promising performance.
| Recommendation | Count | Distribution |
|---|---|---|
| Strong Buy | 0 | |
| Buy | 36 | |
| Hold | 17 | |
| Sell | 1 | |
| Strong Sell | 0 |
Conclusion
Bank of America Corporation demonstrates a steady and reliable financial trajectory, suitable for investors seeking long-term value growth. Though the current rating signifies moderate performance, analyst sentiments and price projections suggest potential upward movement. Investors should monitor macroeconomic factors influencing the banking sector. Despite minor risks associated with market volatility, BAC's established market position and diversified services offer a balanced investment opportunity.
Smart Data Insight
Master the Perfect Entry & Exit for this Stock
Don't leave your profits to chance. Historically, this stock follows specific seasonal patterns that institutional traders use to maximize returns.
- ✅ Identify the "Golden Buying Window"
- ✅ Avoid high-risk correction cycles
- ✅ Backtested data from the last 20+ years