April 13, 2026 a 05:15 am
BAC: Fibonacci Analysis - Bank of America Corporation
Bank of America Corporation has displayed resilience in the financial sector with a diverse range of banking and financial services. Over recent months, the stock has seen significant volatility, yet overall, it has shown a recovery pattern. A thorough technical analysis is essential to understanding potential price movements, especially with macroeconomic factors in play. This Fibonacci analysis aims to provide insight into potential support and resistance levels.
Fibonacci Analysis
| Analysis Detail | Value |
|---|---|
| Start Date of Trend | 2025-04-14 |
| End Date of Trend | 2026-04-09 |
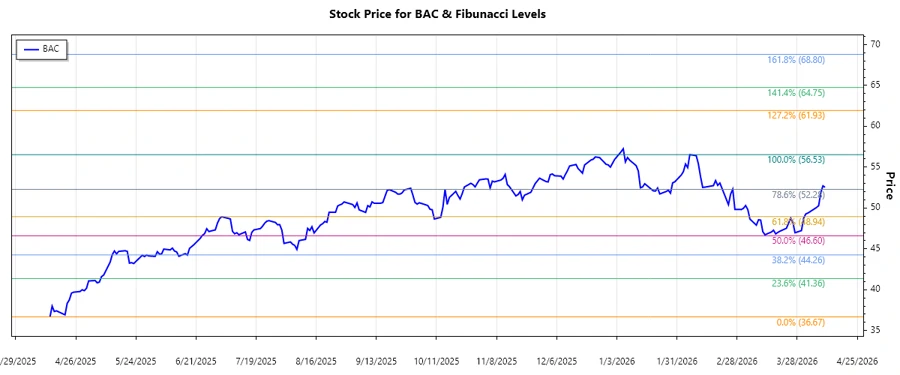
| High Point (Price/Date) | $56.53 on 2026-02-06 |
| Low Point (Price/Date) | $36.67 on 2025-04-14 |
| Fibonacci Level | Price Level |
|---|---|
| 0.236 | $42.83 |
| 0.382 | $45.10 |
| 0.5 | $46.60 |
| 0.618 | $48.10 |
| 0.786 | $50.36 |
The current price of $52.54 suggests that the stock is currently above the 0.786 retracement level, indicating potential strength. This level is likely to act as support in the event of a retracement.
A technical observation suggests that prices above the 0.786 Fibonacci level may indicate strong bullish sentiment, with potential further upside as long as support levels hold.
Conclusion
Bank of America’s stock has shown a strong upward trend from its lows, hinting at bullish momentum. The technical indicators suggest that the stock may continue its upward trajectory, provided macroeconomic conditions remain stable. However, the risk of correction should not be ignored, particularly if global or sector-specific headwinds emerge. For investors, the stock may present a lucrative opportunity if it maintains its momentum above key Fibonacci levels. Continuous monitoring of technical levels and broader economic indicators will be crucial for decision-making.