March 17, 2026 a 03:15 pm
BAC: Fibonacci Analysis - Bank of America Corporation
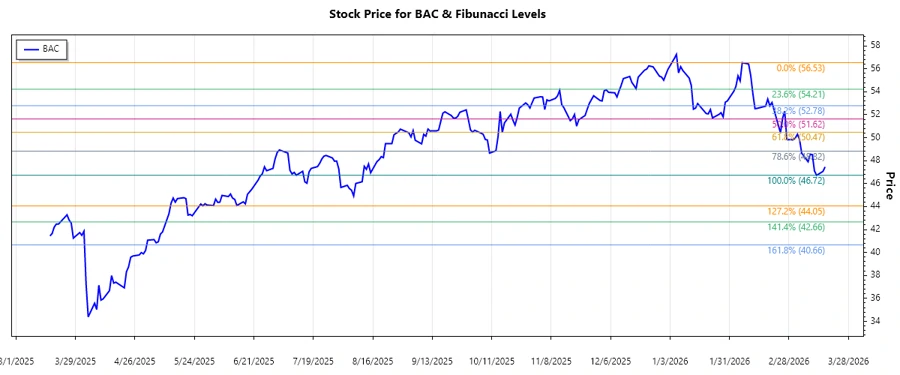
The Bank of America Corporation (BAC) has demonstrated significant market dynamics recently. In the past few months, the stock has shown volatility with a notable downtrend. Investors should consider the technical indicators pointing towards potential retracement levels, which could either provide stabilization or indicate further declines. The stock's recent behavior reflects broader market sentiments and economic conditions impacting financial institutions.
Fibonacci Analysis
| Info | Details |
|---|---|
| Start Date of Trend | 2026-02-06 |
| End Date of Trend | 2026-03-17 |
| High Point | $56.53 (2026-02-06) |
| Low Point | $46.72 (2026-03-13) |
| Fibonacci Level | Price Level |
|---|---|
| 0.236 | $49.36 |
| 0.382 | $51.01 |
| 0.5 | $51.62 |
| 0.618 | $52.23 |
| 0.786 | $53.12 |
Current Price (2026-03-17): $47.45. The stock is below all major Fibonacci retracement levels, suggesting the downtrend is intact. Potential support and resistance areas are at $49.36 and $51.01, respectively, indicating areas where the stock may find short-term support or resistance.
Conclusion
The Bank of America Corporation stock currently exhibits a strong downtrend, having failed to break above significant retracement levels. This trend suggests persistent bearish sentiment, however, the established support zones may allow for a recovery or consolidation phase. Investors should exercise caution and consider broader economic indicators and sector performance. While expected resistance may hinder rapid upward movement, potential market corrections could stabilize the stock momentarily.