February 06, 2026 a 06:44 am
BAC: Fibonacci Analysis - Bank of America Corporation
Bank of America's stock has shown notable movements over the past months, indicative of a substantial upward trend. The financial services giant continues to capitalize on diverse revenue streams, benefiting from both consumer banking and global markets. Analysts are paying close attention to key retracement levels, anticipating potential support or resistance, influencing trading strategies moving forward.
Fibonacci Analysis
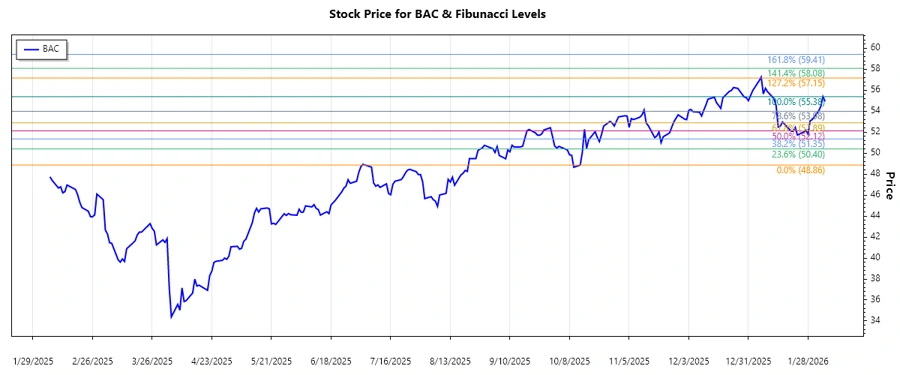
This analysis shows a strong upward trend in the Bank of America Corporation stock over the reviewed period, marked by a significant increase from a low point in mid-October to a peak in early February.
| Detail | Information |
|---|---|
| Trend Start Date | 2025-10-13 |
| Trend End Date | 2026-02-06 |
| Low Point (Price & Date) | $48.86 on 2025-10-13 |
| High Point (Price & Date) | $55.38 on 2026-02-04 |
| Fibonacci Levels |
|
| Current Price | $54.94 on 2026-02-05 |
| Retracement Zone | None (Price is above all retracement levels) |
| Interpretation | The stock remains above the top Fibonacci retracement level, suggesting strong support and the potential for continued upward momentum. |
Conclusion
The recent upward trajectory of Bank of America’s stock marks a period of strategic growth and market confidence. Analysts are optimistic about the company's capability to maintain its upward momentum, especially since the stock is currently above key retracement levels. However, potential risks include market volatility and economic shifts that may impact financial sector performance. In summary, BAC presents a compelling opportunity for investors, backed by robust fundamentals and strategic market positioning, yet caution is advised in monitoring broader market trends that could influence short-term stock movements.