August 19, 2025 a 11:32 am

BAC: Dividend Analysis - Bank of America Corporation
Bank of America Corporation demonstrates a robust dividend history with a yield of 2.21%, signifying its commitment to returning value to shareholders. With over 40 years of consistent dividend payments, BAC remains a stable choice for dividend investors.
📊 Overview
| Metric | Value |
|---|---|
| Sector | Financial Services |
| Dividend Yield | 2.21% |
| Current Dividend per Share | 1.23 USD |
| Dividend History | 40 years |
| Last Cut or Suspension | None |
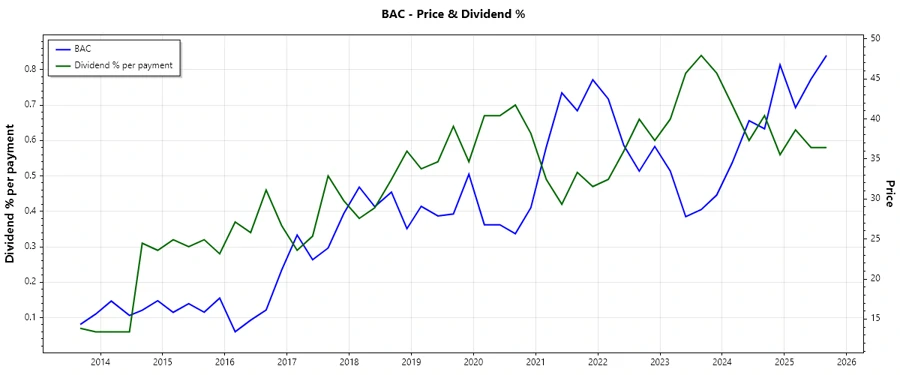
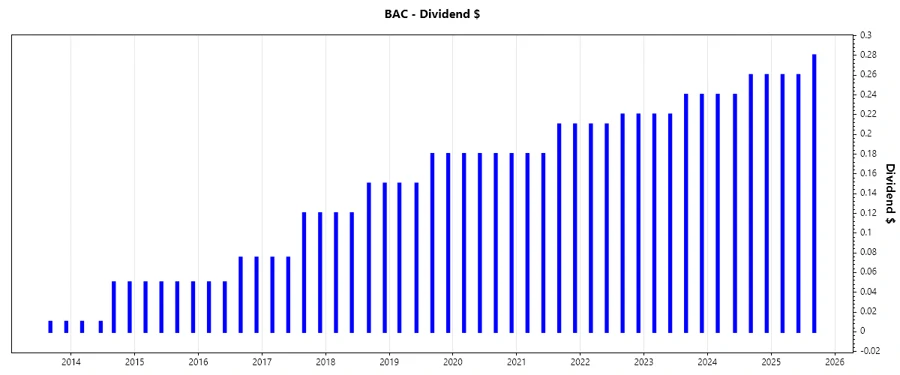
📈 Dividend History
Bank of America's long-standing history of dividend payments reflects its financial stability and commitment to shareholders. This history is a testament to its ability to navigate different economic cycles effectively.
| Year | Dividend per Share (USD) |
|---|---|
| 2025 | 0.80 |
| 2024 | 1.00 |
| 2023 | 0.92 |
| 2022 | 0.86 |
| 2021 | 0.78 |
📈 Dividend Growth
The dividend growth of Bank of America over the recent years indicates moderate, yet persistent, growth. This trend suggests a strategic approach to growing shareholder returns.
| Time | Growth |
|---|---|
| 3 years | 8.63% |
| 5 years | 8.67% |
The average dividend growth is 8.67% over 5 years. This shows moderate but steady dividend growth.
🗣️ Payout Ratio
It is crucial to monitor payout ratios as they provide insight into a firm's dividend sustainability. A balanced payout ratio supports sustainable returns without jeopardizing financial health.
| Key figure | Ratio |
|---|---|
| EPS-based | 33.16% |
| Free cash flow-based | 199.91% |
The EPS payout ratio of 33.16% indicates a conservative payout policy. However, the FCF payout ratio of 199.91% is concerning, necessitating scrutiny of cash flow sufficiency.
✅ Cashflow & Capital Efficiency
Effective management of cash flow and capital efficiency are crucial for maintaining operational liquidity and funding growth prospects.
| Year | 2024 | 2023 | 2022 |
|---|---|---|---|
| Free Cash Flow Yield | -2.59% | 16.64% | -2.35% |
| Earnings Yield | 7.98% | 9.81% | 10.24% |
| CAPEX to Operating Cash Flow | 0% | 0% | 0% |
| Stock-based Compensation to Revenue | 1.88% | 1.71% | 2.49% |
| FCF / Operating Cash Flow Ratio | 1 | 1 | 1 |
The varying free cash flow yield suggests fluctuations in cash generation, while a consistent CAPEX ratio mirrors a steady reinvestment strategy.
📉 Balance Sheet & Leverage Analysis
Analysis of the balance sheet and leverage metrics helps in understanding the firm's financial resilience and ability to honor its obligations.
| Year | 2024 | 2023 | 2022 |
|---|---|---|---|
| Debt-to-Equity | 2.22 | 2.12 | 1.82 |
| Debt-to-Assets | 0.20 | 0.19 | 0.16 |
| Debt-to-Capital | 0.69 | 0.68 | 0.65 |
| Net Debt to EBITDA | 11.51 | 9.10 | 7.92 |
| Current Ratio | 15.07 | 0.30 | 0.22 |
| Quick Ratio | 0.30 | 0.30 | 0.22 |
| Financial Leverage | 11.04 | 10.90 | 11.17 |
The increasing debt levels relative to equity highlight a rising leverage trend, suggesting careful monitoring of the company's borrowing strategy is required.
⚠️ Fundamental Strength & Profitability
Understanding the fundamental strength and profitability ratios offers insights into the firm's efficiency in generating profits.
| Year | 2024 | 2023 | 2022 |
|---|---|---|---|
| Return on Equity | 9.18% | 9.09% | 10.08% |
| Return on Assets | 0.83% | 0.83% | 0.90% |
| Net Margin | 14.10% | 15.42% | 23.93% |
| EBIT Margin | 15.20% | 16.49% | 26.91% |
| EBITDA Margin | 16.34% | 17.68% | 28.64% |
| Gross Margin | 49.92% | 54.79% | 80.32% |
| R&D to Revenue | 0% | 0% | 0% |
The steady returns on equity and assets display a consistent profit generation ability, fundamental to maintaining shareholder confidence.
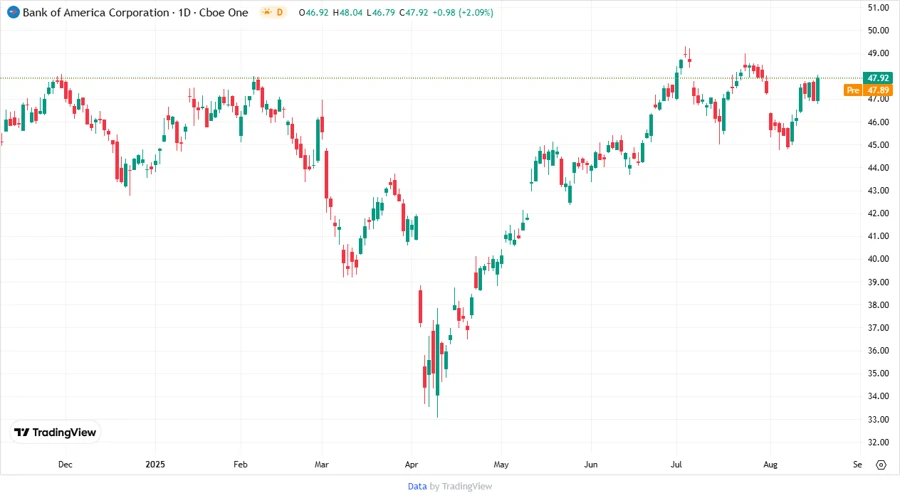
Price Development
✅ Dividend Scoring System
| Category | Score | Bar |
|---|---|---|
| Dividend Yield | 3 | |
| Dividend Stability | 5 | |
| Dividend Growth | 4 | |
| Payout Ratio | 2 | |
| Financial Stability | 4 | |
| Dividend Continuity | 5 | |
| Cashflow Coverage | 3 | |
| Balance Sheet Quality | 3 |
Total Score: 29/40
🗣️ Rating
Overall, Bank of America Corporation presents a robust dividend profile with strong historical continuity and moderate growth. Investors should continue to monitor FCF payout due to financial constraints but can rely on the stability of its dividend payments. A suitable choice for income-focused investors seeking consistent returns.
Smart Data Insight
Master the Perfect Entry & Exit for this Stock
Don't leave your profits to chance. Historically, this stock follows specific seasonal patterns that institutional traders use to maximize returns.
- ✅ Identify the "Golden Buying Window"
- ✅ Avoid high-risk correction cycles
- ✅ Backtested data from the last 20+ years