
July 29, 2026 a 12:31 pm


Asia Countries - Performance Analysis
The financial landscape in Asia has experienced significant oscillations across various timeframes. This analysis delves into the key performance indicators of Asian countries over the past week, month, and quarter. Through a meticulous examination of both top-performers and laggards, insights are drawn to understand underlying trends and economic drivers behind market fluctuations.
Asia Countries Performance One Week 📊
| Country | Performance (%) | Performance |
|---|---|---|
| China | 3.51 | |
| India | 2.44 | |
| Hong Kong | 1.82 | |
| Australia | 1.61 | |
| Japan | -2.57 | |
| South Korea | -11.39 |
One-week analysis indicates a strong positive trend for China, leading the chart, followed by India and Hong Kong. On the downside, South Korea faced notable pressure, posting the steepest decline.
Asia Countries Performance One Month 📊
| Country | Performance (%) | Performance |
|---|---|---|
| China | 11.87 | |
| Hong Kong | 8.63 | |
| Australia | 4.29 | |
| India | 0.35 | |
| Japan | -3.53 | |
| South Korea | -24.59 |
Over the past month, China's substantial growth drove the region’s performance, emphasizing its recovery trajectory. Conversely, South Korea recorded a dramatic dip, significantly impacting the regional outlook.
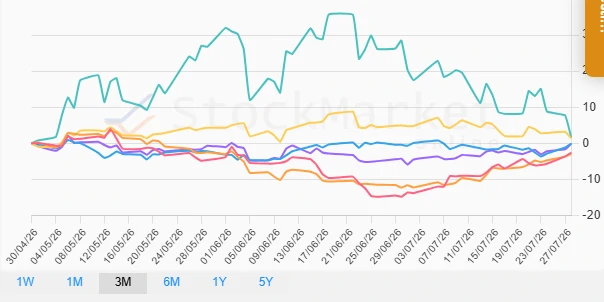
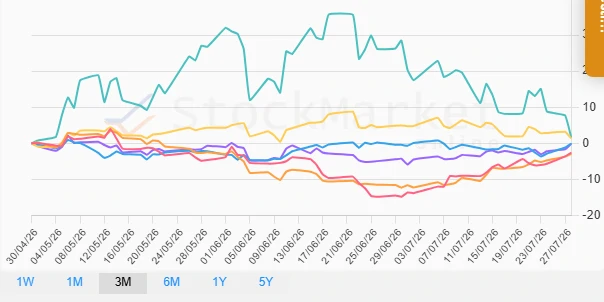
Asia Countries Performance Three Months 📊
| Country | Performance (%) | Performance |
|---|---|---|
| South Korea | 1.69 | |
| Japan | 1.36 | |
| India | -0.09 | |
| Australia | -0.16 | |
| China | -2.60 | |
| Hong Kong | -2.96 |
Over the quarter, South Korea and Japan showed relative resilience, contrasting with the declines observed in other regional markets like Hong Kong and China. The mixed results suggest sector-specific volatility impacting overall regional performance.
Summary 📈
In summary, the varied performances across different timeframes highlight the dynamic nature of Asian financial markets. China's robust growth in the short-term is countered by longer-term volatility, whereas South Korea’s monthly decline overshadowed its quarterly recovery. Strategic investors should remain vigilant to macroeconomic indicators that could influence future trends, such as trade relations and economic policy shifts within the region.
Smart Data Insight
Master the Perfect Entry & Exit for this Stock
Don't leave your profits to chance. Historically, this stock follows specific seasonal patterns that institutional traders use to maximize returns.
- ✅ Identify the "Golden Buying Window"
- ✅ Avoid high-risk correction cycles
- ✅ Backtested data from the last 20+ years