
January 28, 2026 a 12:31 pm


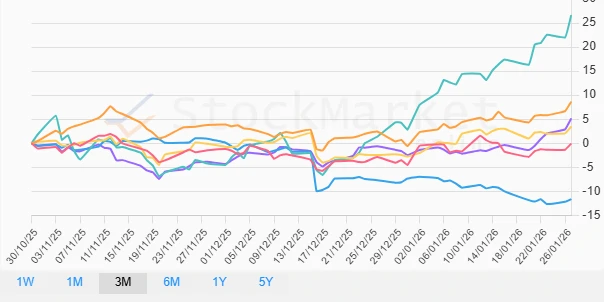
Asia Countries - Performance Analysis
📊 The following analysis provides an in-depth evaluation of the recent performance of key Asian markets over the past week, month, and three months. These insights reveal volatility patterns, growth trends, and notable gainers and laggards. This data is invaluable for investors and analysts seeking to comprehend the dynamic changes within the Asian markets and their future implications.
Asia Countries Performance One Week
📈 Over the past week, South Korea has emerged as the top performer, recording an impressive gain of 6.04%. Australia follows closely with a notable increase of 5.66%, while Hong Kong experienced a considerable upswing of 2.95%. The weak performers include India, which gained the least at 0.49%. Such positive momentum in these markets may reflect robust economic indicators and investor optimism over economic policies.
| Country | Performance (%) | Performance |
|---|---|---|
| South Korea | 6.04 | |
| Australia | 5.66 | |
| Hong Kong | 2.95 | |
| China | 1.53 | |
| Japan | 1.25 | |
| India | 0.49 |
Asia Countries Performance One Month
🔍 In the past month, markets in South Korea have shown remarkable strength with a 22.24% increase, indicating robust economic resilience or investor confidence. Hong Kong and Australia also saw strong performances with gains of 8.25% and 6.52% respectively. Conversely, India faced significant challenges, with its market decreasing by 3.44%. The performance signifies diverse growth dynamics and challenges faced by different economies within the region.
| Country | Performance (%) | Performance |
|---|---|---|
| South Korea | 22.24 | |
| Hong Kong | 8.25 | |
| Australia | 6.52 | |
| Japan | 5.79 | |
| China | 3.97 | |
| India | -3.44 |
Asia Countries Performance Three Months
📉 South Korea continues its strong performance over the past three months with a remarkable 26.60% increase, indicating consistent economic stability and growth prospects. Hong Kong maintains a strong position with an 8.63% increase. On the other hand, India experienced a significant downturn with an 11.63% decrease, highlighting potential headwinds. These movements suggest varying regional economic conditions impacting investor sentiment.
| Country | Performance (%) | Performance |
|---|---|---|
| South Korea | 26.60 | |
| Hong Kong | 8.63 | |
| Australia | 5.15 | |
| Japan | 3.49 | |
| China | -0.09 | |
| India | -11.63 |
Summary
🗣️ In summary, South Korea has consistently outperformed other markets, driven by favorable economic policies and investor confidence. Hong Kong’s substantial gains suggest a positive market outlook, possibly boosted by external trade relations and economic performance. Conversely, India’s declining performance over the past three months indicates potential challenges or market corrections that could invite caution among investors. The analysis underscores the importance of strategic asset allocation tailored to the distinct performance patterns observable across these Asian markets.
Smart Data Insight
Master the Perfect Entry & Exit for this Stock
Don't leave your profits to chance. Historically, this stock follows specific seasonal patterns that institutional traders use to maximize returns.
- ✅ Identify the "Golden Buying Window"
- ✅ Avoid high-risk correction cycles
- ✅ Backtested data from the last 20+ years