
September 24, 2025 a 12:31 pm



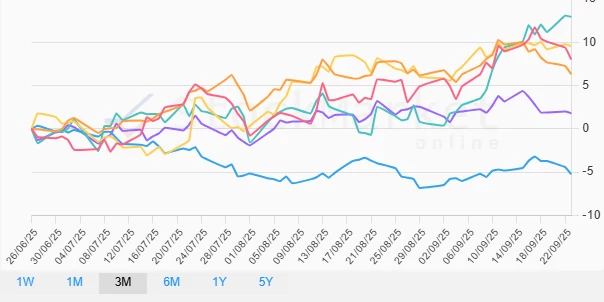
Asia Countries - Performance Analysis
The Asian financial markets exhibit a mixed performance across different time frames. In the short term, we observe considerable volatility, while longer-term analysis reveals significant upward trends in select markets. Strategic insights into these patterns could illuminate opportunities for astute investors seeking exposure to Asian equities.
Asia Countries Performance One Week 📊
The weekly performance shows a heterogeneous pattern across the major Asian markets, with South Korea outperforming, while China and Hong Kong lag significantly.
| Country | Performance (%) | Performance |
|---|---|---|
| South Korea | 2.04% | |
| Japan | -0.10% | |
| Australia | -1.00% | |
| India | -2.04% | |
| Hong Kong | -2.88% | |
| China | -3.70% |
Asia Countries Performance One Month 📈
Over the one-month period, South Korea emerged as a dominant player with a robust 11.47% increase. Japan and China also demonstrated positive returns, highlighting potential sectoral strengths.
| Country | Performance (%) | Performance |
|---|---|---|
| South Korea | 11.47% | |
| Japan | 2.61% | |
| China | 2.59% | |
| Australia | 0.18% | |
| India | -0.69% | |
| Hong Kong | -1.48% |
Asia Countries Performance Three Months 📉
Over a three-month horizon, South Korea exhibited the most substantial growth, while Japan and China also posted solid gains. This period shows potential macroeconomic recovery catalysts in play.
| Country | Performance (%) | Performance |
|---|---|---|
| South Korea | 12.94% | |
| Japan | 9.57% | |
| China | 8.04% | |
| Hong Kong | 6.32% | |
| Australia | 1.81% | |
| India | -5.23% |
Summary 💡
Throughout these examined periods, South Korea consistently stands out as a leader in performance, particularly noted for its one-month and three-month accomplishments. Japan and China reflect strong potential over extended timelines, whereas India's underperformance warrants attention from risk-averse stakeholders. A nuanced approach to asset allocation that leverages these insights could provide strategic advantages in navigating Asia's dynamic markets.
Smart Data Insight
Master the Perfect Entry & Exit for this Stock
Don't leave your profits to chance. Historically, this stock follows specific seasonal patterns that institutional traders use to maximize returns.
- ✅ Identify the "Golden Buying Window"
- ✅ Avoid high-risk correction cycles
- ✅ Backtested data from the last 20+ years