May 20, 2026 a 12:31 pm


Asia Countries - Performance Analysis
In recent weeks, the Asian markets have exhibited significant volatility with notable fluctuations across multiple timeframes. While some countries have shown resilience, the overall landscape suggests a series of challenges influenced by macroeconomic variables. Herein, we provide a comprehensive analysis of the recent market performance across Asia over various timeframes.
Asia Countries Performance One Week 📉
Over the past week, Asian markets have largely experienced declines, with South Korea leading the underperformance at -7.84%. Most countries in the region faced negative pressures, reflecting broader market uncertainties. India, while still negative, managed to exhibit the smallest loss. The steep declines suggest potential macroeconomic headwinds and investor sentiment shifts.
| Country | Performance (%) | Performance |
|---|---|---|
| India | -1.10 | |
| Australia | -2.02 | |
| Japan | -3.04 | |
| Hong Kong | -3.71 | |
| China | -5.24 | |
| South Korea | -7.84 |
Asia Countries Performance One Month 📊
The one-month analysis reveals a stark contrast in performance across the region. South Korea has seen an impressive gain of 16.51%, capitalizing on favorable market conditions or potentially unique economic stimuli. Conversely, India faced significant challenges, declining by 7.00%. Such divergent performances highlight differing economic resilience and market dynamics within the region.
| Country | Performance (%) | Performance |
|---|---|---|
| Hong Kong | 0.66 | |
| Japan | 1.21 | |
| South Korea | 16.51 | |
| China | -3.55 | |
| Australia | -4.98 | |
| India | -7.00 |
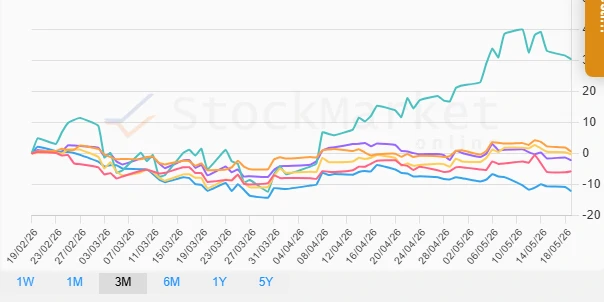
Asia Countries Performance Three Months 📈
In the three-month period, South Korea stands out with a striking 30.51% increase, showcasing marked economic resilience or advantageous market shifts. Meanwhile, India continues to struggle with a steep decline of 12.14%. This period underscores the significant macroeconomic divergences and policy impacts across the region's economies.
| Country | Performance (%) | Performance |
|---|---|---|
| South Korea | 30.51 | |
| Hong Kong | 0.62 | |
| Japan | -0.23 | |
| Australia | -2.22 | |
| China | -5.71 | |
| India | -12.14 |
Summary 💡
Across all analyzed timeframes, South Korea emerges as the standout performer, suggesting robust economic trends and possible favorable policy impacts. India, on the other hand, faces continuous headwinds evident in its consistent negative performance. The remainder of the region shows mixed results, influenced by a variety of local and global economic factors. Investors should consider these trends when making strategic decisions, acknowledging both the volatility and opportunities present within the Asian markets.
Smart Data Insight
Master the Perfect Entry & Exit for this Stock
Don't leave your profits to chance. Historically, this stock follows specific seasonal patterns that institutional traders use to maximize returns.
- ✅ Identify the "Golden Buying Window"
- ✅ Avoid high-risk correction cycles
- ✅ Backtested data from the last 20+ years