
November 19, 2025 a 12:31 pm


Asia Countries - Performance Analysis
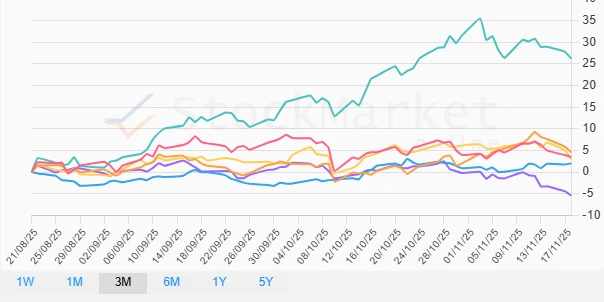
📊 The Asian financial markets have displayed varied performance dynamics over the recent periods under review. Market volatility, influenced by domestic and global macroeconomic factors, has led to diverse performances across countries. This analysis will delve into the weekly, monthly, and quarterly performance metrics, shedding light on the prevailing trends, major movements, and strategic insights for informed investment decisions.
Asia Countries Performance One Week
🔍 Over the past week, Asian markets exhibited significant volatility with predominant underperformance. Hong Kong recorded the largest decline, while India uniquely showed a positive return.
| Country | Performance (%) | Performance |
|---|---|---|
| India | 0.27% | |
| China | -3.46% | |
| Japan | -4.26% | |
| Australia | -4.50% | |
| South Korea | -4.59% | |
| Hong Kong | -4.65% |
Asia Countries Performance One Month
📈 Over the past month, Hong Kong has been the standout performer with a strong positive return, while Australia faced significant challenges as the largest underperformer.
| Country | Performance (%) | Performance |
|---|---|---|
| Hong Kong | 3.19% | |
| South Korea | 1.82% | |
| India | 0.00% | |
| China | -2.32% | |
| Japan | -3.27% | |
| Australia | -6.99% |
Asia Countries Performance Three Months
✅ The three-month analysis highlights South Korea’s remarkable performance, outpacing others with a robust return, while Australia remained the underperformer.
| Country | Performance (%) | Performance |
|---|---|---|
| South Korea | 26.26% | |
| Hong Kong | 4.60% | |
| China | 3.51% | |
| Japan | 2.98% | |
| India | 2.00% | |
| Australia | -5.40% |
Summary
🗣️ In summary, the performance analysis reveals South Korea's exceptional three-month performance, indicating potential investment opportunities considering its continued uptrend. Conversely, Australia's consistent underperformance across different timeframes prompts caution. Overall, tailored strategic approaches are recommended, aligning with individual risk tolerances and market conditions.💡
Smart Data Insight
Master the Perfect Entry & Exit for this Stock
Don't leave your profits to chance. Historically, this stock follows specific seasonal patterns that institutional traders use to maximize returns.
- ✅ Identify the "Golden Buying Window"
- ✅ Avoid high-risk correction cycles
- ✅ Backtested data from the last 20+ years