
July 01, 2026 a 12:31 pm


Asia Countries - Performance Analysis
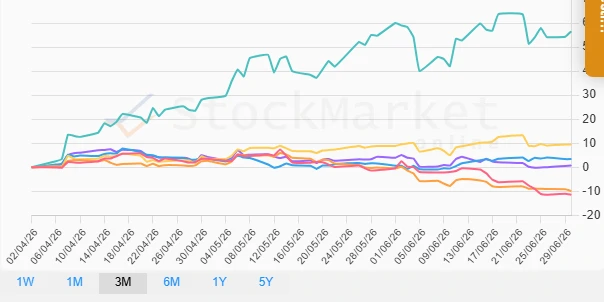
In this comprehensive analysis, we dissect the recent performance of key Asian markets over various durations. With fluctuating global economic indicators and regional geopolitical tensions, investors seek stability and growth opportunities within these dynamic markets. Our focus highlights the standout performers and stragglers across weekly, monthly, and quarterly perspectives, providing valuable insights into prevailing trends and potential future directions.
📊 Asia Countries Performance One Week
| Country | Performance (%) | Performance |
|---|---|---|
| South Korea | 2.49 | |
| Australia | 0.89 | |
| Japan | 0.71 | |
| India | -0.58 | |
| Hong Kong | -1.08 | |
| China | -2.38 |
📈 Asia Countries Performance One Month
| Country | Performance (%) | Performance |
|---|---|---|
| India | 2.74 | |
| Japan | 0.65 | |
| Australia | -3.20 | |
| South Korea | -3.52 | |
| Hong Kong | -9.35 | |
| China | -11.01 |
📉 Asia Countries Performance Three Months
| Country | Performance (%) | Performance |
|---|---|---|
| South Korea | 56.50 | |
| Japan | 9.52 | |
| India | 3.41 | |
| Australia | 0.74 | |
| Hong Kong | -9.85 | |
| China | -11.38 |
✅ Summary
The analysis of Asian markets shows a volatile landscape with South Korea leading over both the one-week and three-month periods, suggesting strong economic momentum or favorable market conditions. Conversely, China and Hong Kong experience consistent underperformance across all three timelines, likely due to macroeconomic challenges or policy headwinds. Investors might consider a strategic positioning focused on diversifying towards countries exhibiting stable economic indicators, while carefully balancing exposure to underperforming but potentially recovering markets.
Smart Data Insight
Master the Perfect Entry & Exit for this Stock
Don't leave your profits to chance. Historically, this stock follows specific seasonal patterns that institutional traders use to maximize returns.
- ✅ Identify the "Golden Buying Window"
- ✅ Avoid high-risk correction cycles
- ✅ Backtested data from the last 20+ years