
June 29, 2026 a 12:31 pm


Countries - Performance Analysis 📊
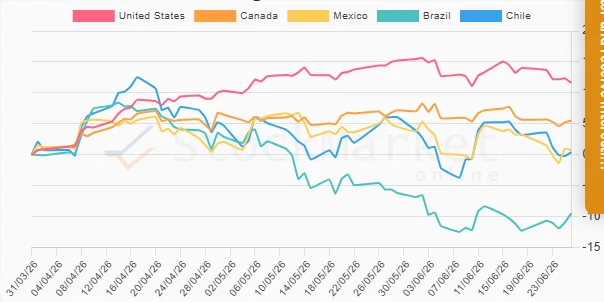
The performance analysis covers three distinct time periods: one week, one month, and three months. Within these time frames, the economic landscapes of several American countries are evaluated based on their market performance. This analysis highlights notable trends, identifying both leaders and laggards across the timeframe. Critical insights into relative performance can guide investment decisions.
Countries Performance One Week 📈
| Country | Performance (%) | Performance |
|---|---|---|
| Brazil | 1.17 | |
| Canada | -0.15 | |
| Mexico | -0.73 | |
| United States | -2.08 | |
| Chile | -3.17 |
Countries Performance One Month 📉
| Country | Performance (%) | Performance |
|---|---|---|
| Canada | -1.65 | |
| Brazil | -3.33 | |
| United States | -3.59 | |
| Mexico | -3.74 | |
| Chile | -5.67 |
Countries Performance Three Months 📊
| Country | Performance (%) | Performance |
|---|---|---|
| United States | 11.62 | |
| Canada | 5.53 | |
| Mexico | 0.76 | |
| Chile | 0.40 | |
| Brazil | -9.52 |
Summary 🗣️
Across the reviewed periods, the United States demonstrated resilience and strength particularly in the three-month timeframe, emerging as a top performer. Canada displayed stable growth, albeit less pronounced, while Mexico and Chile showed mixed results. Brazil faces significant challenges, evidenced by poor one-month and three-month performances. Investors should consider geographical diversification as a strategic move, given the varied performance across different markets.
Smart Data Insight
Master the Perfect Entry & Exit for this Stock
Don't leave your profits to chance. Historically, this stock follows specific seasonal patterns that institutional traders use to maximize returns.
- ✅ Identify the "Golden Buying Window"
- ✅ Avoid high-risk correction cycles
- ✅ Backtested data from the last 20+ years