
September 28, 2026 a 12:31 pm


Countries - Performance Analysis
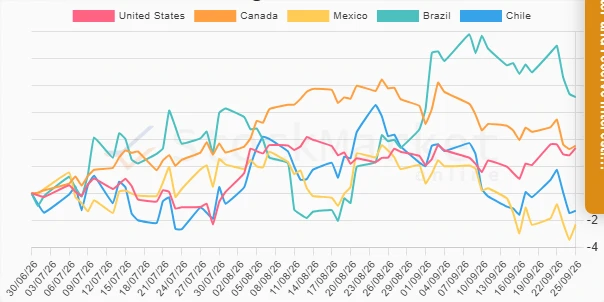
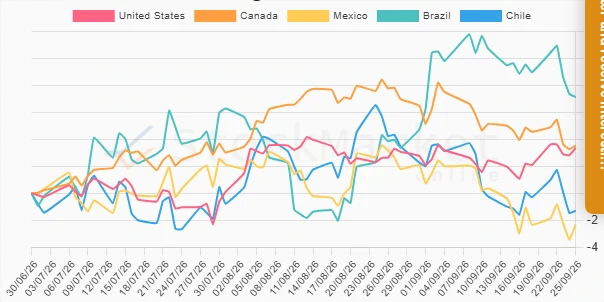
In the ever-evolving landscape of financial markets, the American countries exhibit varying degrees of financial performance, shaped by unique socio-economic and geopolitical factors. Our analysis delves into the one-week, one-month, and three-month performances, highlighting key trends and sectoral shifts. As we navigate these complexities, understanding nuances in market behavior will illuminate pathways for informed investment decisions.
Countries Performance One Week (1W) 📊
In the past week, the performance across American countries revealed a predominantly bearish trend 📉. Brazil, experiencing the steepest decline, faced substantial market pressures, while the United States, although negative, demonstrated relative resilience compared to its regional peers.
| Country | Performance (%) | Performance |
|---|---|---|
| United States | -0.28 | |
| Mexico | -0.47 | |
| Canada | -1.38 | |
| Chile | -2.29 | |
| Brazil | -3.30 |
Countries Performance One Month (1M) ⚠️
Over the past month, Brazil demonstrated remarkable growth 📈, contrasting sharply with the subdued performance in Canada and Mexico. Brazil's positive trajectory is a testament to its robust recovery and strategic economic policies. Conversely, Chile faced the greatest downturn, requiring careful monitoring for potential systemic impacts.
| Country | Performance (%) | Performance |
|---|---|---|
| Brazil | 3.74 | |
| United States | 0.28 | |
| Canada | -3.44 | |
| Mexico | -4.10 | |
| Chile | -4.76 |
Countries Performance Three Months (3M) ✅
The three-month trajectory revealed impressive resilience 🌟, notably with Brazil and Canada leading substantial growth. These gains underscore the effective management and dynamic adaptation within these economies. Although Mexico experienced a downturn, the overall regional trend skewed positive, highlighting optimistic prospects amidst global uncertainties.
| Country | Performance (%) | Performance |
|---|---|---|
| Brazil | 7.11 | |
| Canada | 3.52 | |
| United States | 3.35 | |
| Chile | -1.29 | |
| Mexico | -2.31 |
Summary 🔍
The analysis across three temporal dimensions—one week, one month, and three months—reveals a dynamic interplay of economic factors influencing American countries' performances. Brazil's prominence in medium-term growth highlights its potential as a robust investment opportunity, while persistent challenges in Chile and Mexico suggest the need for strategic realignment and policy interventions. Overall, the positive trajectories in the United States, Canada, and Brazil may indicate a trend towards stabilization and growth, presenting promising avenues for diversifying investment portfolios in the region.
Smart Data Insight
Master the Perfect Entry & Exit for this Stock
Don't leave your profits to chance. Historically, this stock follows specific seasonal patterns that institutional traders use to maximize returns.
- ✅ Identify the "Golden Buying Window"
- ✅ Avoid high-risk correction cycles
- ✅ Backtested data from the last 20+ years