
July 27, 2026 a 12:31 pm


Countries - Performance Analysis
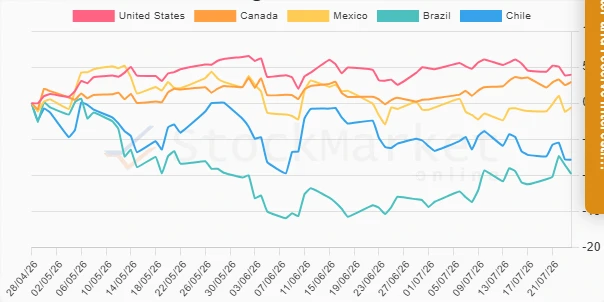
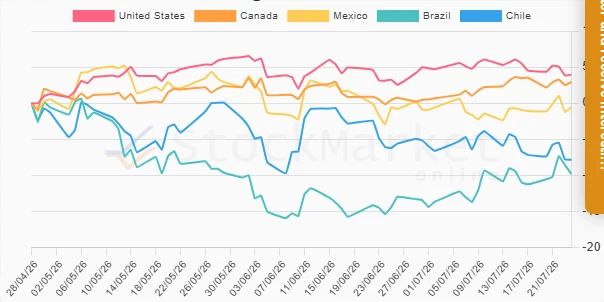
📊 The analysis of the American Countries’ performance reveals dynamic shifts in the regional economic landscape over the past week, month, and three months. By examining fluctuations in major economies, we can identify prevailing trends and growth areas. Let's delve into these metrics and ascertain the implications for potential investors. This report aims to identify top performers and underperformers, providing insights for strategic investment decisions.
Countries Performance One Week
🗣️ The past week reveals a varied performance among American countries, with Canada (+0.77%) and Brazil (+0.75%) emerging as marginal leaders. Despite market fluctuations, the net performance reflects positive sentiment in these regions, while the US (-0.42%) and Chile (-0.46%) exhibit slightly negative trends. This week, Mexico achieved moderate growth (+0.52%), indicative of regional stability. Overall, the data suggests cautious optimism in the Americas.
| Country | Performance (%) | Performance |
|---|---|---|
| Canada | 0.77 | |
| Brazil | 0.75 | |
| Mexico | 0.52 | |
| United States | -0.42 | |
| Chile | -0.46 |
Countries Performance One Month
📈 Over the past month, Brazil's robust growth of 3.18% outpaced other American nations, marking it as a standout performer. Canada followed with a commendable 2.19% increase. However, contrasting performance is noted in Chile, which declined by 2.23%, suggesting headwinds in its market. Mexico's modest 0.20% rise and the US's 1.40% increase highlight mixed regional trends, with cautious growth noted across southern and northern areas.
| Country | Performance (%) | Performance |
|---|---|---|
| Brazil | 3.18 | |
| Canada | 2.19 | |
| United States | 1.40 | |
| Mexico | 0.20 | |
| Chile | -2.23 |
Countries Performance Three Months
📉 The three-month timeframe presents significant variances, with the United States leading at 3.94%. Conversely, Brazil exhibited the largest decline at -9.80%, raising concerns about prolonged negative conditions. Chile too faced sustained losses at -7.84%. Canada's moderate growth of 2.93% contrasts sharply with Mexico's slight dip of -0.60%. The region exhibits a complex interweaving of growth and contraction trends during this period.
| Country | Performance (%) | Performance |
|---|---|---|
| United States | 3.94 | |
| Canada | 2.93 | |
| Mexico | -0.60 | |
| Chile | -7.84 | |
| Brazil | -9.80 |
Summary
✅ In summary, the American countries' performance over varying timeframes reflects both promising growth and significant challenges. Short-term performance highlights Canada as a consistent leader, whereas Brazil's dramatic three-month decrease warrants attention. Investors should closely monitor both positive trends in northern economies and negative trends in southern geographic areas to fine-tune strategies and mitigate risks. Insights gained from these indices underline the importance of regional diversification and strategic asset allocation in pursuit of favorable returns amidst economic variability.
Smart Data Insight
Master the Perfect Entry & Exit for this Stock
Don't leave your profits to chance. Historically, this stock follows specific seasonal patterns that institutional traders use to maximize returns.
- ✅ Identify the "Golden Buying Window"
- ✅ Avoid high-risk correction cycles
- ✅ Backtested data from the last 20+ years