
August 18, 2025 a 12:31 pm


Countries - Performance Analysis
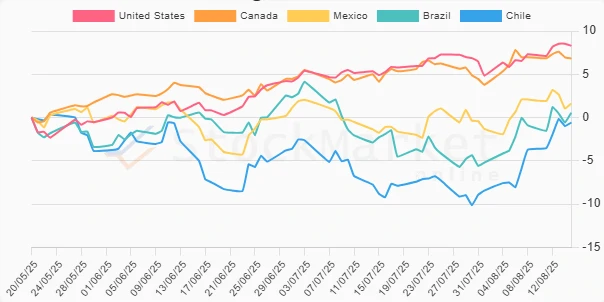
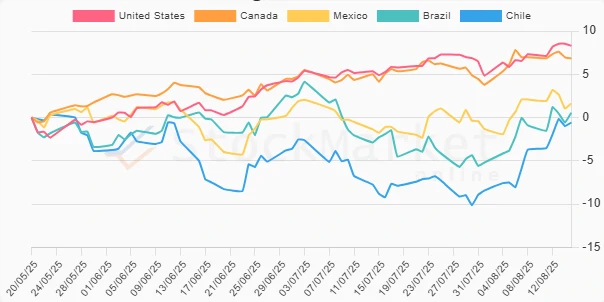
📊 In this performance analysis, we delve into the market movements of American countries over three time frames: one week, one month, and three months. Each timeframe offers insights into the countries that have outperformed and those that have not met expectations. By examining these trends, we aim to provide a comprehensive view of the economic climate affecting these nations. Let's explore the underlying factors and discern the potential implications for investors.
Countries Performance One Week
💡 Over the past week, Chile has emerged as the top performer, boasting a significant positive return. Brazil follows with substantial gains, whereas the United States and Canada show moderate performance. Mexico, however, has faced slight downward pressure. This volatile period highlights the resilience of some markets amid regional challenges.
| Country | Performance (%) | Performance |
|---|---|---|
| Chile | 2.94% | |
| Brazil | 2.05% | |
| United States | 1.18% | |
| Canada | -0.02% | |
| Mexico | -0.31% |
Countries Performance One Month
📈 Over the month, all countries have shown positive performance, a stark contrast to shorter timeframes. Chile outperforms with the highest gains, closely followed by Brazil and Mexico. Investors in these regions have been rewarded, and the trend suggests a robust market environment.
| Country | Performance (%) | Performance |
|---|---|---|
| Chile | 7.29% | |
| Brazil | 5.05% | |
| Mexico | 3.23% | |
| United States | 2.52% | |
| Canada | 1.49% |
Countries Performance Three Months
🔍 In the three-month perspective, the United States leads with a strong rally, followed by Canada, which also shows robust performance. Chile, however, experiences a minor setback. This more extended period suggests strategic considerations might differ from those in shorter intervals as economic policies and global influences continue to shift dynamically.
| Country | Performance (%) | Performance |
|---|---|---|
| United States | 8.30% | |
| Canada | 6.83% | |
| Mexico | 1.61% | |
| Brazil | 0.54% | |
| Chile | -0.59% |
Summary
✅ The performance across different time frames reveals the intricate dynamics within the American market landscape. While short-term trends reflect volatility and resilience in certain markets, the longer perspectives highlight strategic growth, particularly in the United States and Chile. Investors should continue monitoring these shifts closely, as geopolitical factors and domestic policies can significantly impact future performances.
Smart Data Insight
Master the Perfect Entry & Exit for this Stock
Don't leave your profits to chance. Historically, this stock follows specific seasonal patterns that institutional traders use to maximize returns.
- ✅ Identify the "Golden Buying Window"
- ✅ Avoid high-risk correction cycles
- ✅ Backtested data from the last 20+ years