
August 17, 2026 a 12:31 pm


Countries - Performance Analysis
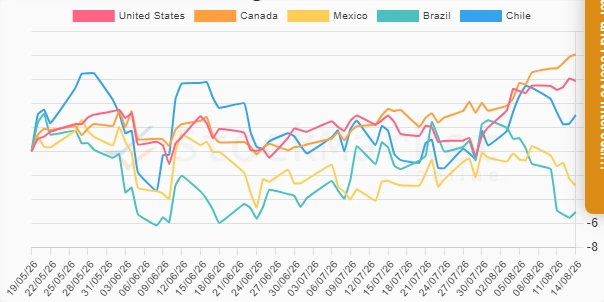
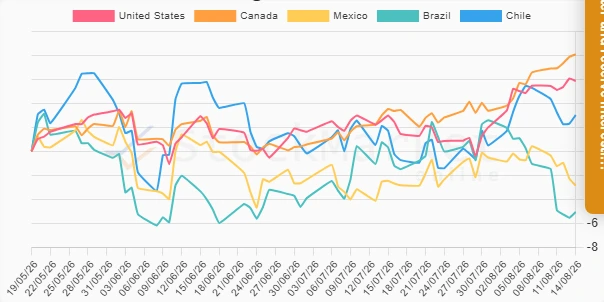
📊 This analysis provides insights into the recent performance trends of key American countries over three distinct timeframes: one week, one month, and three months. Observations reveal fluctuating trends with distinct top performers and underperformers across each period. The volatility and regional economic conditions are reflected through these variances. Below, we delve deeper into each timeframe and draw a comprehensive picture of the financial market performance.
Countries Performance One Week
🗣️ Over the past week, Canada's financial market emerged as the top performer with a gain of 1.18%, followed closely by the United States at 0.43%. In contrast, Brazil witnessed the largest decline at -3.59%. The majority of countries faced headwinds, indicating a predominantly negative trend in the region. The data suggests heightened market volatility possibly influenced by geopolitical or economic factors. Overall, the short-term performance suggests caution in the region's financial markets.
| Country | Performance (%) | Performance |
|---|---|---|
| Canada | 1.18 | |
| United States | 0.43 | |
| Chile | -1.35 | |
| Mexico | -2.51 | |
| Brazil | -3.59 |
Countries Performance One Month
📉 Over the past month, Canada continued its lead with a 4.62% gain, displaying resilience in its markets. The United States also reported positive results with a 4.41% increase. Notably, Chile followed closely with 3.74%. However, Brazil's market maintained a downward trajectory, showing a similar range of decline (-3.57%) as observed in the weekly performance. The month-long trends show positive inclinations for stronger markets and suggest economic stabilizations in certain regions.
| Country | Performance (%) | Performance |
|---|---|---|
| Canada | 4.62 | |
| United States | 4.41 | |
| Chile | 3.74 | |
| Mexico | -0.03 | |
| Brazil | -3.57 |
Countries Performance Three Months
📈 The quarterly review uncovers Canada's sustained momentum with the highest performance of 8.06%. The United States also maintained positive growth with 5.85%. Chile's consistent performance over three months shows a promising regional economic outlook. However, Brazil and Mexico remain in negative territory, perhaps alluding to ongoing internal challenges or external pressures. Overall, the quarterly performance reflects a mix of resilience and vulnerability among American nations.
| Country | Performance (%) | Performance |
|---|---|---|
| Canada | 8.06 | |
| United States | 5.85 | |
| Chile | 3.00 | |
| Mexico | -2.86 | |
| Brazil | -5.06 |
Summary
✅ The analysis highlights Canada's consistent top performance across all timeframes, showcasing its stable market environment amidst regional volatility. The United States follows closely, reinforcing its position as a robust market. Chile presents a steady upward trend, offering potential investment opportunities. Conversely, Brazil and Mexico face challenges impacting their market dynamics. Overall, while some markets exude promise and growth, others require strategic interventions to overcome prevailing adversities. Investors might consider diversifying their portfolios to include standout performers like Canada and the US while remaining cautious with underperformers.
Smart Data Insight
Master the Perfect Entry & Exit for this Stock
Don't leave your profits to chance. Historically, this stock follows specific seasonal patterns that institutional traders use to maximize returns.
- ✅ Identify the "Golden Buying Window"
- ✅ Avoid high-risk correction cycles
- ✅ Backtested data from the last 20+ years