
July 13, 2026 a 12:31 pm


Countries - Performance Analysis
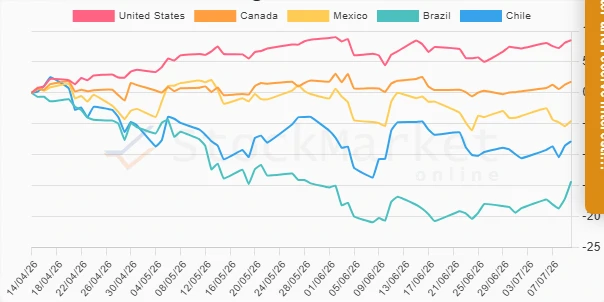
In the recent periods, significant shifts in the performance of major American countries have been observed. Each country exhibits unique drivers influenced by both macro and microeconomic factors, resulting in varied short-term and medium-term performance metrics. This analysis delves into the nuances of these performances over the past week, month, and three months, foregrounding both top-performers and notable underperformers. Here, we provide a comprehensive view of regional dynamics and their potential implications for investors.
📊 Countries Performance One Week
Analyzing the one-week performance, Brazil outpaced its peers with a robust gain, positioning itself as a focal point of growth. Chile and Canada also displayed commendable upticks. The underperformance of Mexico is noteworthy, indicating potential economic instability or market-specific challenges. The U.S. marked a modest ascent, reflecting moderate resilience in contrast to other countries' trends.
| Country | Performance (%) | Performance |
|---|---|---|
| Brazil | 2.91% | |
| Chile | 1.39% | |
| Canada | 1.02% | |
| United States | 0.49% | |
| Mexico | -2.05% |
📈 Countries Performance One Month
The one-month assessment underscores a steady outperformance by Brazil, maintaining this trend over a longer period. In contrast, Mexico exhibits significant volatility, manifesting as the greatest loss. This performance disparity suggests varied economic conditions and sectoral shifts within each country. Investors may look towards Brazil’s consistency, as opposed to the unresolved factors affecting Mexico.
| Country | Performance (%) | Performance |
|---|---|---|
| Brazil | 2.46% | |
| United States | 1.82% | |
| Canada | -0.17% | |
| Chile | -3.07% | |
| Mexico | -4.58% |
📉 Countries Performance Three Months
Over the three-month horizon, the United States demonstrates exceptional strength, markedly outperforming other countries. Conversely, Brazil exhibits substantial decline, suggesting possible economic policy changes or international trade impacts. As the top performer, the U.S. presents a potential haven for stability, whereas Brazil's downturn warrants cautious engagement.
| Country | Performance (%) | Performance |
|---|---|---|
| United States | 8.53% | |
| Canada | 1.79% | |
| Mexico | -4.55% | |
| Chile | -7.84% | |
| Brazil | -14.33% |
✅ Summary
In summation, the analysis highlights notable differences in country performance across varied timeframes. Brazil's initial strong short-term performance shifts markedly into a downturn over the three-month period. The U.S. remains strong overall, providing investors with a potential anchor during unstable conditions in Latin America. The persistent underperformance of Mexico warrants further analysis to identify the underlying causes and assess future risks. Strategic allocation towards stable yet dynamic markets like the U.S. is advised, accompanied by a prudent review of volatile regions like Brazil in the longer term.
Smart Data Insight
Master the Perfect Entry & Exit for this Stock
Don't leave your profits to chance. Historically, this stock follows specific seasonal patterns that institutional traders use to maximize returns.
- ✅ Identify the "Golden Buying Window"
- ✅ Avoid high-risk correction cycles
- ✅ Backtested data from the last 20+ years