
November 09, 2026 a 12:31 pm


Countries - Performance Analysis
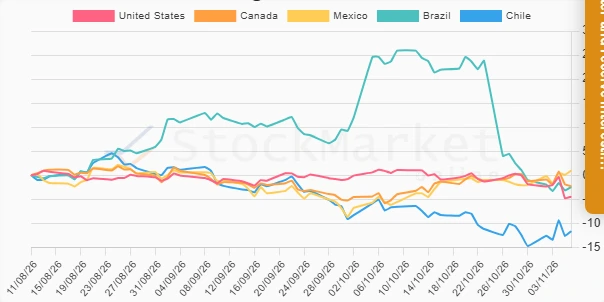
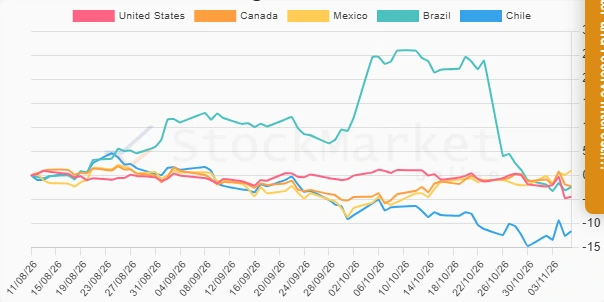
📊 Welcome to an in-depth analysis of the performance of countries in the Americas, focusing on the last week, month, and three months. This analysis will identify top performers as well as underperformers across the different periods, showcasing trends and insights essential for investors. By examining these data points, we aim to provide a comprehensive understanding of current economic dynamics in the region.
Countries Performance One Week
🗣️ Within the past week, Mexico emerged as the top performer with a positive return of 1.16%, trailed by Chile with a 0.96% gain. On the downside, the United States recorded a decline of 2.15%, indicating potential market volatility. Canada's negative 1.39% performance signals a cautious outlook, whereas Brazil's smaller decline of 0.53% suggests resilience in its markets. Here are the weekly figures comprehensively:
| Country | Performance (%) | Performance |
|---|---|---|
| Mexico | 1.16% | |
| Chile | 0.96% | |
| Brazil | -0.53% | |
| Canada | -1.39% | |
| United States | -2.15% |
Countries Performance One Month
🗣️ Over the past month, Mexico maintained its position as a standout performer with a significant gain of 6.54%. In contrast, Brazil faced a sharp decline of 28.38%, possibly reflecting macroeconomic challenges. Canada stood out with a moderate gain of 1.66%, while the United States and Chile recorded losses of 5.56% and 5.09%, respectively, suggesting sectoral pressures. The monthly data is as follows:
| Country | Performance (%) | Performance |
|---|---|---|
| Mexico | 6.54% | |
| Canada | 1.66% | |
| Chile | -5.09% | |
| United States | -5.56% | |
| Brazil | -28.38% |
Countries Performance Three Months
🗣️ Over the past three months, Mexico has consistently outperformed with a gain of 0.99%. Persistent negative trends are observed in Chile and Brazil with declines of 11.63% and 2.46%, respectively, potentially highlighting structural economic challenges. The United States and Canada both experienced modest declines of 4.47% and 2.28%, suggesting mixed macroeconomic indicators. Here are the three-month performance specifics:
| Country | Performance (%) | Performance |
|---|---|---|
| Mexico | 0.99% | |
| Canada | -2.28% | |
| Brazil | -2.46% | |
| United States | -4.47% | |
| Chile | -11.63% |
Summary
💡 In summary, Mexico has demonstrated resilience across all periods, consistently achieving positive returns. The most notable challenge lies with Brazil, particularly in the one-month period, which demands close scrutiny and perhaps tactical readjustments from investors. Meanwhile, the significant losses in the United States and Chile highlight potential regional economic pressures influencing their markets. As global economies recalibrate, investors should monitor these dynamics closely, considering diversification strategies to mitigate regional volatilities.
Smart Data Insight
Master the Perfect Entry & Exit for this Stock
Don't leave your profits to chance. Historically, this stock follows specific seasonal patterns that institutional traders use to maximize returns.
- ✅ Identify the "Golden Buying Window"
- ✅ Avoid high-risk correction cycles
- ✅ Backtested data from the last 20+ years