
September 07, 2026 a 12:31 pm


Countries - Performance Analysis
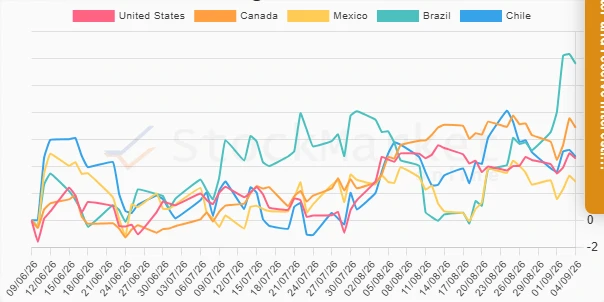
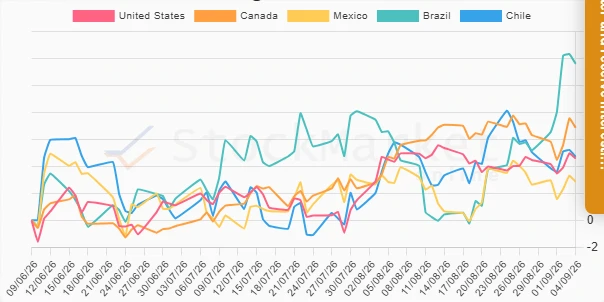
The American continent has shown varied financial performance trends over the recent weeks, months, and quarters. The analysis highlights the standout performers, as well as those who have struggled. By examining the data, we can identify patterns and correlations in the financial markets across these countries. This insight helps investors and analysts to make informed decisions regarding future investments. We will assess the detailed performance of selected countries across three timeframes: 1 week, 1 month, and 3 months.
Countries Performance One Week 📊
The weekly performance reflects a positive surge in Brazil with a notable increase of 5.06%, indicating robust market activity. Canada and Chile also showcased growth, while the United States and Mexico experienced modest to minimal changes. These short-term trends can provide a glimpse into the market directions and investor sentiments currently influencing the American markets.
| Country | Performance (%) | Performance |
|---|---|---|
| Brazil | 5.06 | |
| Canada | 1.03 | |
| Chile | 0.85 | |
| United States | 0.41 | |
| Mexico | -0.10 |
Countries Performance One Month 📈
Over a month, Brazil maintained its leading position with a remarkable 7.13% rise. Interestingly, Canada also recorded substantial gains of 1.29%. However, Mexico and Chile reported declines, suggesting regional economic challenges or specific sectoral pressures. The United States also saw a slight downturn, possibly due to broader market corrections or investor sentiment shifts.
| Country | Performance (%) | Performance |
|---|---|---|
| Brazil | 7.13 | |
| Canada | 1.29 | |
| United States | -0.38 | |
| Chile | -0.90 | |
| Mexico | -1.07 |
Countries Performance Three Months 📉
Brazil continues its strong performance with an 11.58% surge over the quarter, serving as a bastion of growth in the region. Canada also showed a solid upward trend of 6.85%. Chile, the United States, and Mexico report positive trends, reflecting broader positive economic patterns and possible recovery signs in these markets. The consistent gains across multiple countries suggest potential for investment and diversification opportunities.
| Country | Performance (%) | Performance |
|---|---|---|
| Brazil | 11.58 | |
| Canada | 6.85 | |
| Chile | 4.70 | |
| United States | 4.57 | |
| Mexico | 2.86 |
Summary 🔍
In summary, Brazil consistently dominates as the top performer across all timeframes, indicating robust fiscal health and investment potential. Canada also demonstrates reliable growth, particularly in the longer three-month span. However, the mixed performance of the United States and struggles within Mexico and Chile highlight areas requiring cautious analysis. Investors should focus on the underlying factors driving Brazil's success and consider opportunities for volatility leverage. Overall, diversification remains a key strategy in optimizing returns across these varied markets.
Smart Data Insight
Master the Perfect Entry & Exit for this Stock
Don't leave your profits to chance. Historically, this stock follows specific seasonal patterns that institutional traders use to maximize returns.
- ✅ Identify the "Golden Buying Window"
- ✅ Avoid high-risk correction cycles
- ✅ Backtested data from the last 20+ years