July 07, 2025 a 12:31 pm


Countries - Performance Analysis 📊
The recent performance metrics across American countries reveal significant variances, offering rich insights into the dynamics driving these markets. From short-term fluctuations to robust quarterly performance, understanding these trends enables a strategic outlook on investment opportunities. By dissecting weekly, monthly, and quarterly data, key outperformers and underperforming markets are identified, providing a deeper grasp of regional economic health and investment potential.
Countries Performance One Week 📈
The initial analysis of the one-week data highlights Mexico as the top performer with a 1.87% increase, reflecting strong market momentum in the short term. Conversely, Chile, although positive, displays the least growth at 1.18%, indicating potentially subdued market activity. This variation across countries suggests differing stages of economic recovery and investor sentiment.
| Country | Performance (%) | Performance |
|---|---|---|
| Mexico | 1.87 | |
| Brazil | 1.59 | |
| United States | 1.21 | |
| Canada | 1.01 | |
| Chile | 1.18 |
Countries Performance One Month 📈
Over the past month, Brazil achieved the highest performance at 5.66%, underlining its market strength. Meanwhile, Chile reported minimal growth, barely at 0.14%, suggesting potential economic challenges or market restraints affecting its progress. Such data provides valuable insight into the monthly trends and shifting economic conditions.
| Country | Performance (%) | Performance |
|---|---|---|
| Brazil | 5.66 | |
| United States | 4.32 | |
| Canada | 2.80 | |
| Mexico | 0.85 | |
| Chile | 0.14 |
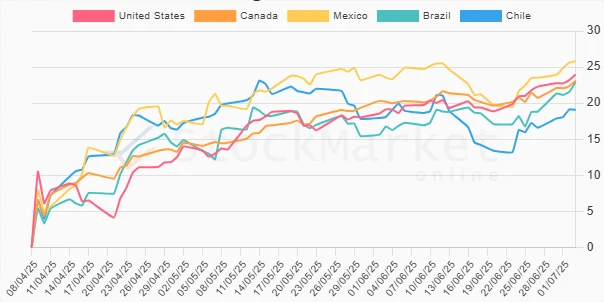
Countries Performance Three Months 📈
The quarterly performance snapshot positions Mexico as the lead at an impressive 25.8%, indicating substantial market appreciation. While not leading, Chile's performance of 19.06% is still commendable, though it trails behind its counterparts. These three-month observations emphasize broader economic resilience and growth potential within specific regional markets.
| Country | Performance (%) | Performance |
|---|---|---|
| Mexico | 25.80 | |
| United States | 23.98 | |
| Canada | 23.10 | |
| Brazil | 22.94 | |
| Chile | 19.06 |
Summary ✅
In summary, the distinctive performance across different timeframes echoes the multifaceted nature of these economies. Mexico consistently emerges as a leader, showcasing its robust market situation. Unveiling the subtleties in these performances, this analysis aids investors in crafting a well-informed geographical and temporal strategy, balancing risks and maximizing returns in the context of Americas' evolving market landscape.
Smart Data Insight
Master the Perfect Entry & Exit for this Stock
Don't leave your profits to chance. Historically, this stock follows specific seasonal patterns that institutional traders use to maximize returns.
- ✅ Identify the "Golden Buying Window"
- ✅ Avoid high-risk correction cycles
- ✅ Backtested data from the last 20+ years