August 08, 2025 a 10:15 am

AZO: Fibonacci Analysis - AutoZone, Inc.
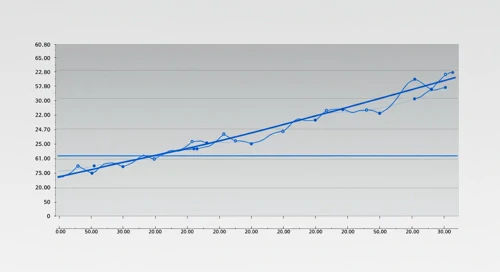
AutoZone, Inc. has showcased a strong performance in the automotive retail market, supported by its extensive inventory and robust store presence in the United States, Mexico, and Brazil. Recent trends indicate a notable uptrend in the stock price, demonstrating resilience amidst broader market fluctuations. The company's strategic initiatives and consistent growth trajectory position it well for future gains.
Fibonacci Analysis
| Analysis Detail | Value |
|---|---|
| Trend Start Date | 2024-11-01 |
| Trend End Date | 2025-08-07 |
| High Point (Price/Date) | $4072.80 / 2025-08-06 |
| Low Point (Price/Date) | $2981.19 / 2024-11-01 |
| Fibonacci Levels |
|
| Current Price Status | Currently within the 0.5 retracement level. |
| Interpretation | The current retracement to the 0.5 level indicates potential support, however, a breakthrough could signify further declines or reversal. |
Conclusion
AutoZone's stock performance has been notably robust, influenced by strategic business efforts and favourable market conditions. The current Fibonacci analysis suggests AutoZone’s stock is approaching a critical 0.5 retracement level, which could act as a support or resistance. Investors should stay vigilant as a breakthrough of this level could indicate a pivot in the trend. While there's ample opportunity for continued uptrend, risks remain should market conditions change adversely. A watchful eye on external market influencers and AutoZone's operational performance remains essential for stakeholders and analysts moving forward.
Smart Data Insight
Master the Perfect Entry & Exit for this Stock
Don't leave your profits to chance. Historically, this stock follows specific seasonal patterns that institutional traders use to maximize returns.
- ✅ Identify the "Golden Buying Window"
- ✅ Avoid high-risk correction cycles
- ✅ Backtested data from the last 20+ years