September 09, 2025 a 09:03 am


AXP: Trend and Support & Resistance Analysis - American Express Company
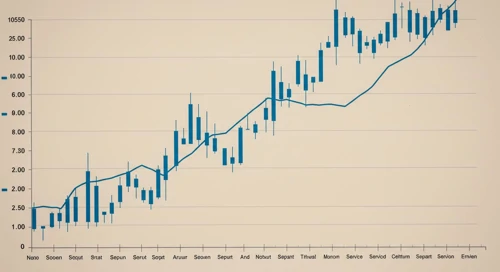
The American Express Company (AXP) continues to dominate the credit payment card products and travel-related services markets worldwide. Recent data analysis suggests that the stock is experiencing a notable trend, influenced by market factors and company performance. Understanding these trends and market zones is vital for strategic investors aiming to capitalize on potential gains. The technical analysis further explores the underlying movements, essential for making informed investment decisions.
Trend Analysis
Recent analysis of American Express Company's stock data suggests significant market movement. By calculating the EMA20 and EMA50 from the closing prices, it indicates a dominant trend in one direction.
| Date | Close Price | Trend |
|---|---|---|
| 2025-09-08 | 325.41 | ▲ |
| 2025-09-05 | 326.22 | ▲ |
| 2025-09-04 | 330.65 | ▲ |
| 2025-09-03 | 323.71 | ▼ |
| 2025-09-02 | 331.18 | ▲ |
| 2025-08-29 | 331.28 | ▲ |
| 2025-08-28 | 326.99 | ▼ |
The trend is identified as an upward trend indicated by EMA20 being greater than EMA50. This trend suggests a bullish market sentiment towards the AXP stock.
Support and Resistance
Analyzing the support and resistance levels provides insight into potential reversal and continuation zones in the market.
| Zone Type | From | To |
|---|---|---|
| Support | 321.00 | 325.00 |
| Support | 315.00 | 320.00 |
| Resistance | 333.00 | 338.00 |
| Resistance | 340.00 | 345.00 |
The current price is approaching a resistance zone between 333.00 and 338.00. This suggests that the next moves will be critical in determining whether the stock can break through this zone.
Conclusion
American Express (AXP) currently exhibits a strong upward trend with potential for further gains if the resistance levels are surpassed. The technical analysis suggests cautious optimism for investors. Market participants should monitor economic and financial announcements for broader market impacts on the stock. While there are buying opportunities, analysts should be vigilant about potential reversals at resistance levels. The comprehensive analysis highlights the importance of staying informed on technical indicators to maximize investment outcomes.
Smart Data Insight
Master the Perfect Entry & Exit for this Stock
Don't leave your profits to chance. Historically, this stock follows specific seasonal patterns that institutional traders use to maximize returns.
- ✅ Identify the "Golden Buying Window"
- ✅ Avoid high-risk correction cycles
- ✅ Backtested data from the last 20+ years