August 10, 2025 a 01:15 pm


AXP: Trend and Support & Resistance Analysis - American Express Company
American Express, a leader in global financial services, has shown notable market movements leading to strategic positioning opportunities. With products spanning payment cards and travel services, the company's financial performance is a key interest to investors. Recent data suggests shifting trends influenced by broader economic conditions and company-specific developments.
Trend Analysis
Analyzing the recent data, the trend for American Express (AXP) displays fluctuating patterns. Calculating the Exponential Moving Averages (EMA) for the 20 and 50-day periods provides insights:
| Date | Close Price | Trend |
|---|---|---|
| 2025-08-08 | $297.43 | ▲ |
| 2025-08-07 | $294.73 | ▼ |
| 2025-08-06 | $295.54 | ▼ |
| 2025-08-05 | $296.64 | ▲ |
| 2025-08-04 | $298.59 | ▲ |
| 2025-08-01 | $294.27 | ▲ |
| 2025-07-31 | $299.31 | ▲ |
The moving averages indicate a moderate upward trend with EMA20 slightly above EMA50, suggesting bullish sentiment. This technical pattern reflects potential positive momentum for AXP.
Support and Resistance
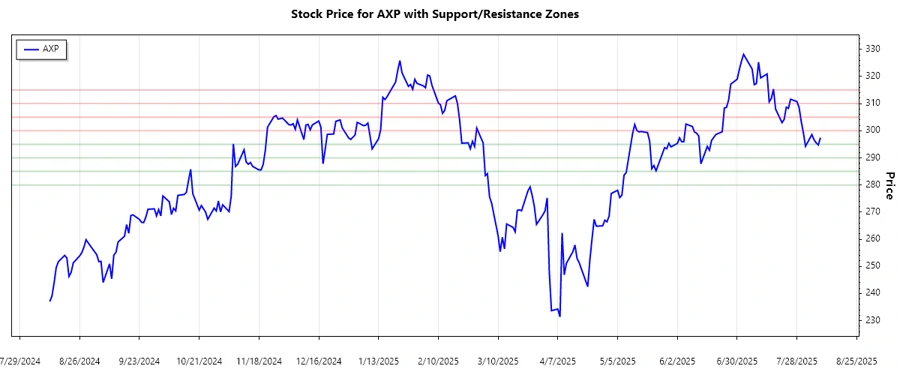
Identifying key support and resistance zones for AXP can help in understanding potential market behaviors:
| Zone Type | Zone Range |
|---|---|
| Support | $290.00 ➜ $295.00 |
| Support | $280.00 ➜ $285.00 |
| Resistance | $300.00 ➜ $305.00 |
| Resistance | $310.00 ➜ $315.00 |
Currently, the stock is trading near the lower resistance zone, suggesting potential challenges in breaking higher levels. This implies careful watching of price actions near these levels.
Conclusion
American Express shows resilience amid economic variability, reflected in its upward trend. Support and resistance levels are crucial in assessing price behavior, signaling potential investment opportunities. Continuous monitoring of moving averages and price zones can guide strategic decisions. These analyses underscore AXP's market potential against systemic financial dynamics. While risks involve economic shifts, the strategic market position offers possible growth avenues for discerning investors.
Smart Data Insight
Master the Perfect Entry & Exit for this Stock
Don't leave your profits to chance. Historically, this stock follows specific seasonal patterns that institutional traders use to maximize returns.
- ✅ Identify the "Golden Buying Window"
- ✅ Avoid high-risk correction cycles
- ✅ Backtested data from the last 20+ years