January 22, 2026 a 03:43 pm

AXP: Fundamental Ratio Analysis - American Express Company
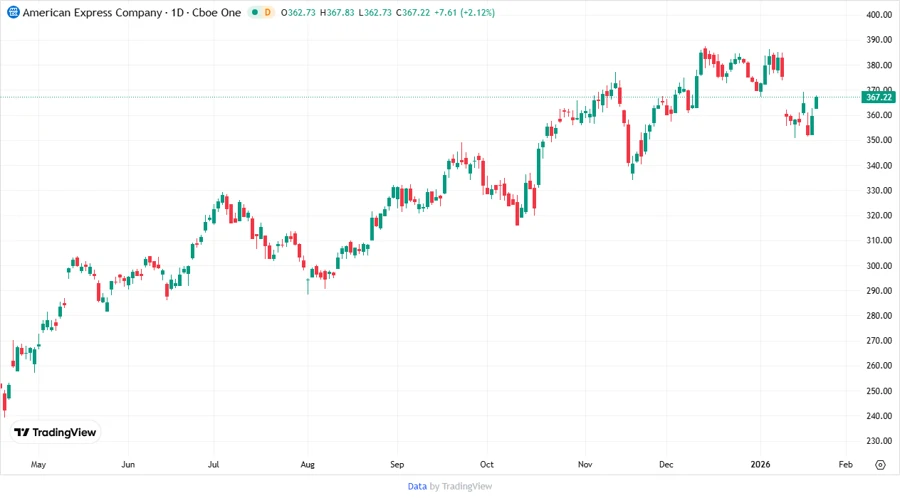
American Express Company has been a significant player in the financial services sector, known for its diverse array of charge and credit payment card products along with travel-related services. While the company demonstrates strength in its established brand and global presence, it faces competition from both traditional banks and new fintech entities. This analysis provides insights into AXP's fundamental ratings and market performance outlook.
Fundamental Rating
American Express Company exhibits a moderate fundamental rating with strengths in discounted cash flow and return on equity metrics.
| Category | Score | Visualization |
|---|---|---|
| Discounted Cash Flow | 5 | |
| Return on Equity | 5 | |
| Return on Assets | 4 | |
| Debt to Equity | 1 | |
| Price to Earnings | 2 | |
| Price to Book | 1 |
Historical Rating
Comparative historical data allows tracking of AXP's score changes over time, signaling consistency in their performance metrics.
| Date | Overall Score | DCF | ROE | ROA | D/E | P/E | P/B |
|---|---|---|---|---|---|---|---|
| 2026-01-21 | 3 | 5 | 5 | 4 | 1 | 2 | 1 |
| Null Date | 0 | 5 | 5 | 4 | 1 | 2 | 1 |
Analyst Price Targets
Analyst estimates reflect a range of expected price outcomes, with a consensus indicating caution among experts.
| Target | Price |
|---|---|
| High | $425 |
| Low | $295 |
| Median | $390 |
| Consensus | $376 |
Analyst Sentiment
Analyst sentiment is predominantly neutral, with a majority of hold recommendations, highlighting a cautious outlook.
| Recommendation | Count | Visualization |
|---|---|---|
| Strong Buy | 0 | |
| Buy | 21 | |
| Hold | 31 | |
| Sell | 4 | |
| Strong Sell | 0 |
Conclusion
American Express Company demonstrates solid financial health through strong cash flow and equity returns. However, the presence of high competition and moderate leverage ratios pose potential risks. While analyst sentiments are conservative, robust brand recognition and diversification across financial services provide a buffer against market volatility. Investors should consider these factors when assessing AXP for portfolio inclusion.