
September 29, 2025 a 07:43 pm

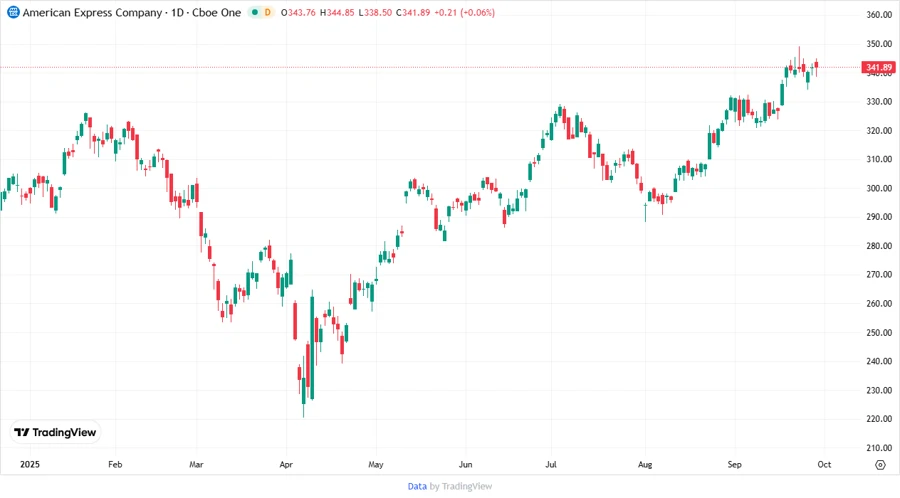
AXP: Fundamental Ratio Analysis - American Express Company
American Express Company operates in the financial services sector, providing a diverse range of products and services. With steady growth and strong market presence, AXP offers opportunities for long-term investors. However, potential risks due to market fluctuations should be considered.
Fundamental Rating
The fundamental rating provides insights into the company's financial health. AXP shows a solid overall performance with room for improvement in debt management and valuation ratios.
| Category | Score | Visualization |
|---|---|---|
| Overall Score | 3 | |
| Discounted Cash Flow | 4 | |
| Return on Equity | 5 | |
| Return on Assets | 4 | |
| Debt to Equity | 1 | |
| Price to Earnings | 1 | |
| Price to Book | 1 |
Historical Rating
The historical ratings indicate consistent performance with slight variations. Monitoring these trends aids in evaluating future prospects.
| Date | Overall Score | DCF | ROE | ROA | Debt/Equity | P/E | P/B |
|---|---|---|---|---|---|---|---|
| 2025-09-29 | 3 | 4 | 5 | 4 | 1 | 1 | 1 |
| Historical | 0 | 4 | 5 | 4 | 1 | 1 | 1 |
Analyst Price Targets
Analyst estimates suggest a stable outlook with the potential for significant appreciation.
| High | Low | Median | Consensus |
|---|---|---|---|
| 375 | 277 | 368.5 | 347.25 |
Analyst Sentiment
The consensus among analysts is to hold, with a balanced number of buy and hold recommendations.
| Recommendation | Count | Visualization |
|---|---|---|
| Strong Buy | 0 | |
| Buy | 24 | |
| Hold | 27 | |
| Sell | 4 | |
| Strong Sell | 0 |
Conclusion
American Express Company demonstrates a robust financial standing with positive growth indications. The current market conditions suggest holding the stock while evaluating for potential buy opportunities. The firm's commitment to expanding its network services and travel solutions could enhance market positioning. However, low scores in debt-to-equity and valuation ratios indicate caution. Overall, the stock is suitable for long-term investment with an eye on market dynamics.
Smart Data Insight
Master the Perfect Entry & Exit for this Stock
Don't leave your profits to chance. Historically, this stock follows specific seasonal patterns that institutional traders use to maximize returns.
- ✅ Identify the "Golden Buying Window"
- ✅ Avoid high-risk correction cycles
- ✅ Backtested data from the last 20+ years