May 09, 2026 a 10:15 am
AXP: Fibonacci Analysis - American Express Company
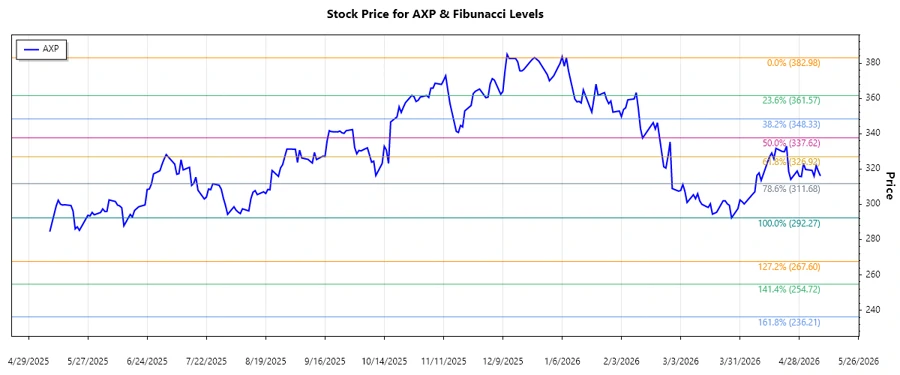
American Express has shown a notable bearish trend over the recent months. As a major player in the credit card industry, its performance can be heavily dependent on consumer spending patterns. Given the current trend, investors might be cautious, looking for potential reversal signs or support levels based on historical price action.
Fibonacci Analysis
| Information | Details |
|---|---|
| Trend Start Date | 2026-01-08 |
| Trend End Date | 2026-05-08 |
| High Price (Date) | 382.98 (2026-01-08) |
| Low Price (Date) | 292.27 (2026-03-27) |
| Fibonacci Levels |
|
| Current Price | 316.03 |
| Retracement Zone | none |
| Interpretation | The current price does not sit directly within any significant Fibonacci retracement level, suggesting the stock is below potential support zones, indicating further caution for traders. |
Conclusion
The analysis of American Express Company’s stock displays a marked downward trend, with its price recently stabilizing at lower levels. From a technical perspective, if it doesn’t break through significant Fibonacci retracement levels soon, the bearish sentiment might persist. This represents a risk for short-term investors but might offer a buying opportunity for long-term investors searching for undervalued stocks. However, given the prevailing broader economic conditions, analysts should remain cautious, as consumer spending dynamics could affect future performance.
Smart Data Insight
Master the Perfect Entry & Exit for this Stock
Don't leave your profits to chance. Historically, this stock follows specific seasonal patterns that institutional traders use to maximize returns.
- ✅ Identify the "Golden Buying Window"
- ✅ Avoid high-risk correction cycles
- ✅ Backtested data from the last 20+ years