
July 18, 2026 a 03:31 am

AXP: Dividend Analysis - American Express Company
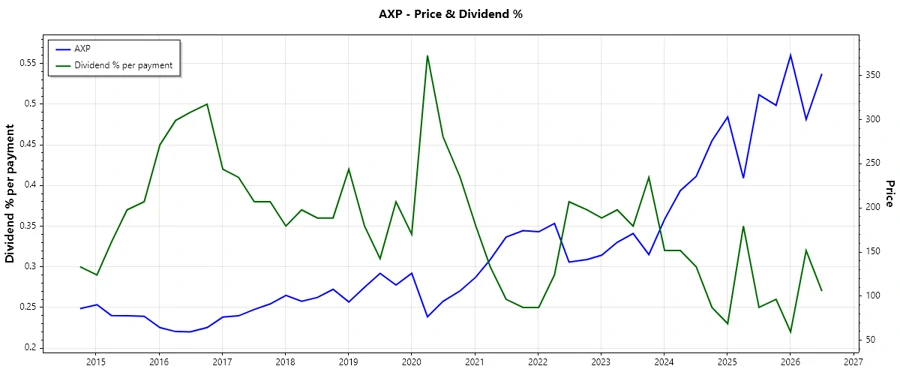
American Express Company presents an investment opportunity with its prestigious position in the credit services sector. With a reasonable dividend yield and solid growth history, it is an attractive choice for dividend investors. The company's robust financial health further supports its capability to sustain and grow dividends, appealing to both defensive and growth-seeking investors.
📊 Overview
American Express, a leader in the financial services sector, offers a competitive dividend profile supported by its established market presence.
| Metrics | Details |
|---|---|
| Sector | Financial Services |
| Dividend yield | 1.01 % |
| Current dividend per share | 3.27 USD |
| Dividend history | 50 years |
| Last cut or suspension | None |
🗣️ Dividend History
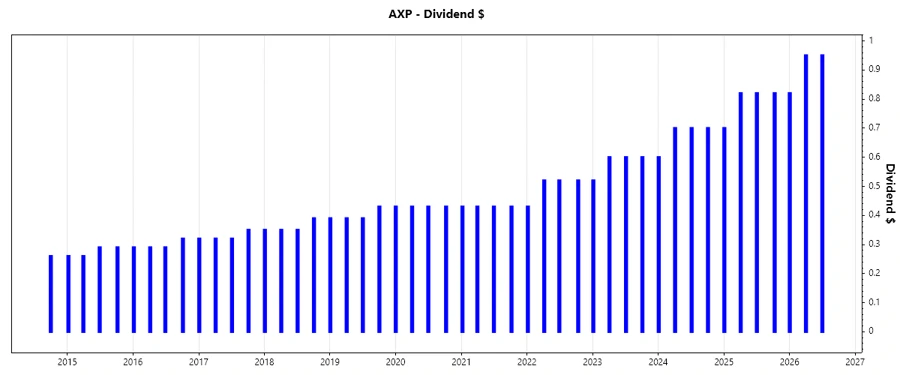
The long and stable history of dividend payments underlines American Express's commitment to returning value to shareholders. Historical stability is crucial for assessing reliability and future expectations.
| Year | Dividend per Share (USD) |
|---|---|
| 2026 | 2.72 |
| 2025 | 3.16 |
| 2024 | 2.70 |
| 2023 | 2.32 |
| 2022 | 1.99 |
📈 Dividend Growth
The consistent dividend growth reinforces confidence in American Express's ability to enhance shareholder value. This growth is essential as it suggests future income and capital appreciation through dividends.
| Time | Growth |
|---|---|
| 3 years | 16.67 % |
| 5 years | 12.94 % |
The average dividend growth is 12.94 % over 5 years. This shows moderate but steady dividend growth, illustrating the company's ability to generate consistent income growth.
✅ Payout Ratio
Examining the payout ratio is vital as it indicates financial flexibility and sustainability in dividend distributions.
| Key figure | Ratio |
|---|---|
| EPS-based | 19.98 % |
| Free cash flow-based | 15.57 % |
The low payout ratios suggest that American Express maintains a conservative approach, allowing room for reinvestment and financial resilience.
💡 Cashflow & Capital Efficiency
Reliable cash flows and efficient capital utilization are crucial for sustaining dividends and ensuring financial robustness.
| 2023 | 2024 | 2025 | |
|---|---|---|---|
| Free Cash Flow Yield | 12.34% | 5.74% | 6.22% |
| Earnings Yield | 6.08% | 4.79% | 4.21% |
| CAPEX to Operating Cash Flow | 8.42% | 13.60% | 13.16% |
| Stock-based Compensation to Revenue | 0.67% | 0.68% | 0.68% |
| Free Cash Flow / Operating Cash Flow Ratio | 91.58% | 86.39% | 86.84% |
The strong cash flow generation and capital efficiency significantly support American Express's ability to fund dividends sustainably.
⚖️ Balance Sheet & Leverage Analysis
A solid balance sheet with manageable leverage is critical for long-term solvency and liquidity.
| 2023 | 2024 | 2025 | |
|---|---|---|---|
| Debt-to-Equity | 1.75 | 1.69 | 1.73 |
| Debt-to-Assets | 0.19 | 0.19 | 0.19 |
| Debt-to-Capital | 0.64 | 0.63 | 0.63 |
| Net Debt to EBITDA | 0.22 | 0.72 | 0.65 |
| Current Ratio | 0.33 | 0.27 | 0.28 |
| Quick Ratio | 0.33 | 0.27 | 0.28 |
| Financial Leverage | 9.31 | 8.97 | 8.96 |
While the company's leverage is higher, the robust interest coverage ratio and financial stability ensure the firm's resilience against economic cycles.
🚀 Fundamental Strength & Profitability
Strong profitability and favorable return metrics are indicators of a company's operational efficiency and shareholder value creation.
| 2023 | 2024 | 2025 | |
|---|---|---|---|
| Return on Equity | 29.85% | 33.47% | 32.36% |
| Return on Assets | 3.21% | 3.73% | 3.61% |
| Net Profit Margin | 12.43% | 13.65% | 13.46% |
| Research & Development to Revenue | 0.00% | 0.00% | 0.00% |
The superior return metrics indicate efficient asset use and effective capital management, positioning American Express as a financial powerhouse.
📉 Price Development
🏆 Dividend Scoring System
| Criteria | Description | Score |
|---|---|---|
| Dividend Yield | Attractive yet stable yield | |
| Dividend Stability | 50-year history | |
| Dividend Growth | Consistent increases | |
| Payout Ratio | Resilient payout | |
| Financial Stability | Strong balance sheet | |
| Dividend Continuity | No cuts observed | |
| Cashflow Coverage | Well-covered dividends | |
| Balance Sheet Quality | Manageable leverage |
Total Score: 31/40
⭐ Rating
American Express Company stands out as a reliable dividend payer with a strong track record and commendable financial health. The company is well-positioned to potentially drive shareholder value through sustainable and growing dividends, making it a strategic choice for long-term income-focused investors.
Smart Data Insight
Master the Perfect Entry & Exit for this Stock
Don't leave your profits to chance. Historically, this stock follows specific seasonal patterns that institutional traders use to maximize returns.
- ✅ Identify the "Golden Buying Window"
- ✅ Avoid high-risk correction cycles
- ✅ Backtested data from the last 20+ years