March 23, 2026 a 06:44 am

AXON: Fibonacci Analysis - Axon Enterprise, Inc.
Axon Enterprise, Inc., known for its innovative advancements in conducted energy devices and law enforcement solutions, shows notable promise in the current market environment. The company's strategic partnerships and diversified product offerings bolster its position as a leader in its field. However, recent market fluctuations present potential risks alongside opportunities for growth depending on technological adoption rates and regulatory changes.
Fibonacci Analysis
| Start Date | End Date | High Point | Low Point |
|---|---|---|---|
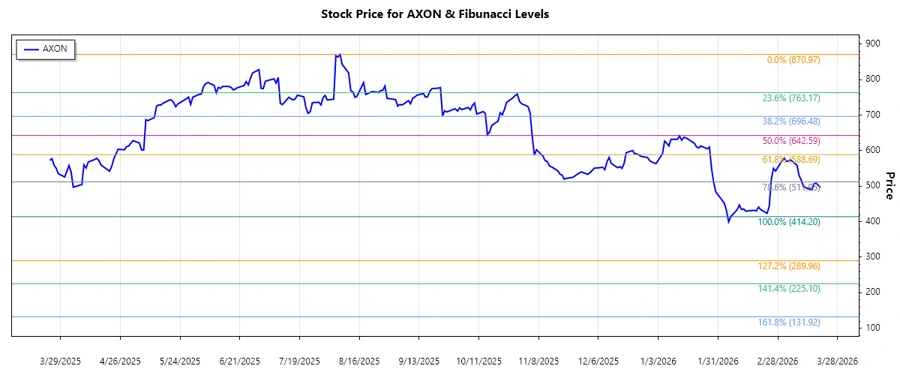
| 2025-08-07 | 2026-03-20 | $870.97 (2025-08-07) | $414.20 (2026-02-06) |
| Fibonacci Level | Price |
|---|---|
| 0.236 | $525.97 |
| 0.382 | $585.11 |
| 0.5 | $642.59 |
| 0.618 | $700.07 |
| 0.786 | $783.78 |
The current stock price of AXON is $496.27, located within the 0.236 - 0.382 retracement zone. Technically, this suggests a potential support level, but caution is essential as volatility may persist.
Conclusion
The recent downtrend in Axon Enterprise's stock from its peak outlines significant market adjustments. Chances lie in dynamic technology advancements and strong strategic partnerships, while challenges include market volatility and regulatory landscapes. For financial analysts, monitoring these price levels could indicate crucial support or resistance zones. Being vigilant about market signals will be essential in navigating future price actions, as potential recoveries or further declines remain plausible outcomes.