September 19, 2025 a 04:45 pm

AXON: Fibonacci Analysis - Axon Enterprise, Inc.
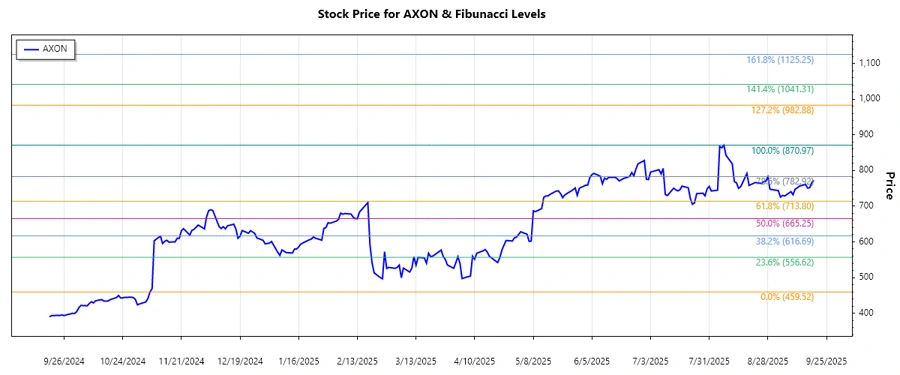
Axon Enterprise, Inc. has shown considerable strength in the market, primarily driven by its innovative product lines and strategic partnerships. The stock has managed to sustain a dominant uptrend over the past months, suggesting strong investor confidence in its growth potential. As we delve into the Fibonacci analysis, it becomes essential to gauge if the current price levels align with historically significant retracement zones that could indicate potential support or resistance.
Fibonacci Analysis
| Detail | Information | ||||||||||||
|---|---|---|---|---|---|---|---|---|---|---|---|---|---|
| Trend Start Date | 2024-11-06 | ||||||||||||
| Trend End Date | 2025-08-07 | ||||||||||||
| High Point (Price & Date) | $870.97 on 2025-08-07 | ||||||||||||
| Low Point (Price & Date) | $459.52 on 2024-11-06 | ||||||||||||
| Fibonacci Levels |
|
||||||||||||
| Current Retracement Zone | 0.5 | ||||||||||||
| Technical Interpretation | The current price is within the 0.5 retracement level, indicating a potential pivotal zone where the market might experience support if the trend continues. However, if the price falls below this level, it might test the next Fibonacci retracement level. |
Conclusion
The continuous upward trajectory for Axon Enterprise, Inc. indicates a robust market presence and suggests potential for future gains. However, the stock currently finds itself at a critical juncture within the 0.5 Fibonacci retracement level, which may serve as a technical support. Despite such optimistic outlooks, investors must be cautious of market volatility and external factors that may impact the stock's performance. Monitoring these retracement levels can provide insights into key points that might act as either support or resistance, aiding traders in strategic decision-making.
Smart Data Insight
Master the Perfect Entry & Exit for this Stock
Don't leave your profits to chance. Historically, this stock follows specific seasonal patterns that institutional traders use to maximize returns.
- ✅ Identify the "Golden Buying Window"
- ✅ Avoid high-risk correction cycles
- ✅ Backtested data from the last 20+ years