November 22, 2025 a 07:31 am

AWK: Dividend Analysis - American Water Works Company, Inc.
American Water Works Company, Inc. (AWK) presents a compelling profile for dividend-focused investors. With a steady history of dividend growth and a disciplined payout strategy, the company stands strong amidst its sector peers. However, the negative free cash flow yield and specific payout ratios offer areas for cautious assessment.
📊 Overview
AWK is positioned within the Utility sector, offering a dividend yield of approximately 2.47%. The current dividend per share is set at $3.00, marking a significant 18-year history of consistent payouts, with the last dividend modification occurring in 2013. These metrics highlight a stable dividend profile built over years of careful financial management.
| Key Metric | Value |
|---|---|
| Sector | Utility |
| Dividend yield | 2.47 % |
| Current dividend per share | 3 USD |
| Dividend history | 18 years |
| Last cut or suspension | 2013 |
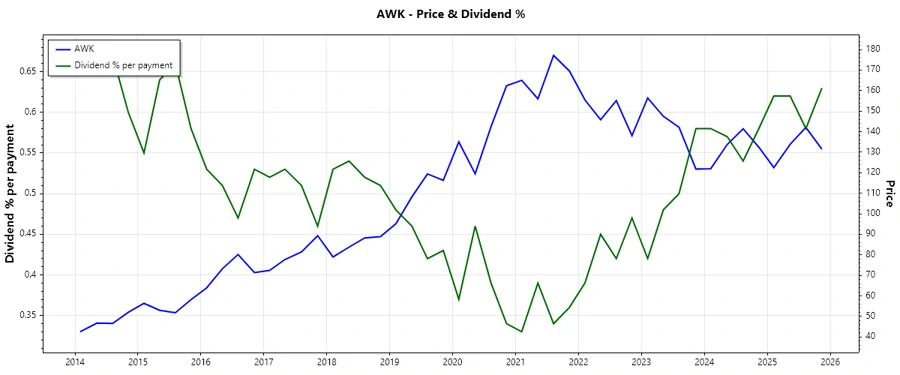
📉 Dividend History
Reviewing AWK's dividend history reveals a pattern of reliable dividend disbursement, essential for investor confidence in long-term income generation. This stability is visually represented below.
| Year | Dividend per Share (USD) |
|---|---|
| 2025 | 3.2475 |
| 2024 | 3.0025 |
| 2023 | 2.7775 |
| 2022 | 2.5675 |
| 2021 | 2.3575 |
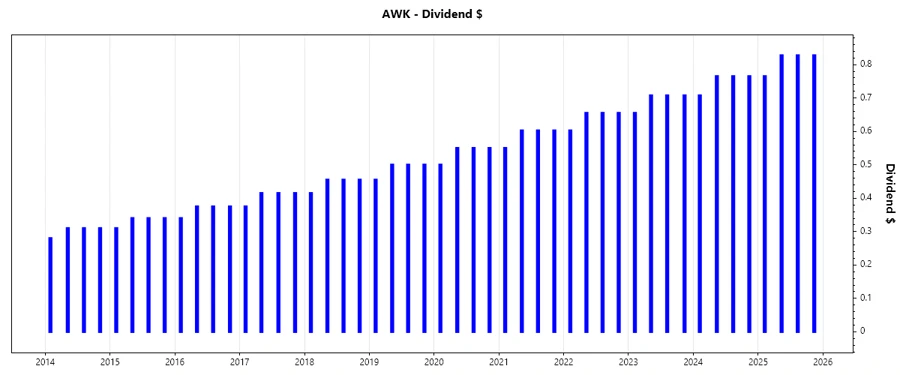
📈 Dividend Growth
AWK's dividend growth rates over the past years suggest a sustainable and consistent rise, enhancing the value proposition for the shareholders. The chart below details this growth.
| Time | Growth |
|---|---|
| 3 years | 8.40 % |
| 5 years | 8.96 % |
The average dividend growth is 8.96% over 5 years. This shows moderate but steady dividend growth.
✅ Payout Ratio
The payout ratio provides insights into the company's ability to maintain its dividend payouts relative to earnings and free cash flow. For AWK, the EPS-based payout is at 52.61%, while the free cash flow-based payout is negative, which requires further analysis considering the negative free cash flow yield.
| Key figure ratio | Value |
|---|---|
| EPS-based | 52.61 % |
| Free cash flow-based | -59.92 % |
The EPS-based payout ratio suggests a healthy distribution from earnings, whereas the free cash flow payout warns of potential cash constraints.
⚠️ Cashflow & Capital Efficiency
Examining cash flow statistics and capital efficiency provides insights into AWK's operational health and profitability.
| Year | Metric | 2024 | 2023 | 2022 |
|---|---|---|---|---|
| Free Cash Flow Yield | -0.03 | -0.03 | -0.05 | |
| Earnings Yield | 0.04 | 0.04 | 0.03 | |
| CAPEX to Operating Cash Flow | 1.48 | 1.46 | 2.18 | |
| Stock-based Compensation to Revenue | 0.01 | 0.00 | 0.00 | |
| Free Cash Flow / Operating Cash Flow Ratio | -0.40 | -0.46 | -1.18 |
The analysis shows constraints in free cash flow, necessitating careful monitoring. Efficient capital management remains crucial.
🗣️ Balance Sheet & Leverage Analysis
AWK's balance sheet metrics highlight its financial stability and capacity to handle debt. These factors influence its operational efficiency and capacity to manage obligations.
| Year | Metric | 2024 | 2023 | 2022 |
|---|---|---|---|---|
| Debt-to-Equity | 1.37 | 1.27 | 1.62 | |
| Debt-to-Assets | 0.43 | 0.41 | 0.45 | |
| Debt-to-Capital | 0.58 | 0.56 | 0.62 | |
| Net Debt to EBITDA | 5.25 | 5.13 | 6.19 | |
| Current Ratio | 0.39 | 0.65 | 0.44 | |
| Quick Ratio | 0.35 | 0.59 | 0.41 | |
| Financial Leverage | 3.18 | 3.09 | 3.61 |
A relatively high leverage indicates significant obligations; thus, maintaining adequate liquidity is crucial for AWK's operational resilience.
📊 Fundamental Strength & Profitability
AWK's profitability and fundamental performance serve as indicators of its sustainable growth potential and operational efficiency.
| Year | Metric | 2024 | 2023 | 2022 |
|---|---|---|---|---|
| Return on Equity | 10.17% | 9.64% | 10.66% | |
| Return on Assets | 3.20% | 3.12% | 2.95% | |
| Margins: Net | 22.44% | 22.30% | 21.62% | |
| Margins: EBIT | 40.18% | 39.11% | 35.60% | |
| Margins: EBITDA | 57.00% | 55.74% | 52.72% | |
| Margins: Gross | 60.33% | 59.38% | 58.10% | |
| Research & Development to Revenue | 0% | 0% | 0% |
The company showcases robust profitability metrics, affirming its capacity to generate returns on investments and sustain dividend payouts.
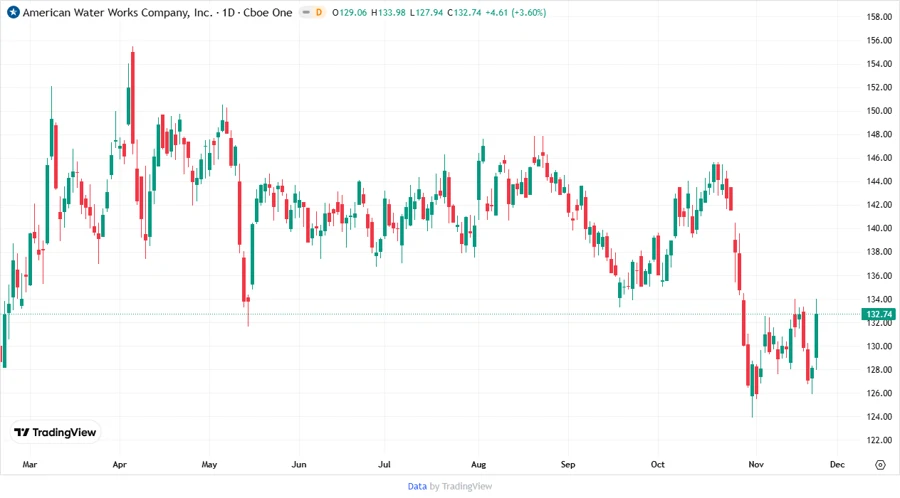
Price Development
📊 Dividend Scoring System
| Criterion | Score | Bar |
|---|---|---|
| Dividend yield | 4 | |
| Dividend Stability | 5 | |
| Dividend growth | 4 | |
| Payout ratio | 3 | |
| Financial stability | 3 | |
| Dividend continuity | 5 | |
| Cashflow Coverage | 2 | |
| Balance Sheet Quality | 3 |
Total Score: 29/40
✅ Rating
American Water Works Company, Inc. presents a promising dividend profile strengthened by consistent growth and stable returns. Despite challenges with payout supported by cash flow, the company's robust operations and strategic financial management offer a reliable source of income. Our recommendation is to consider AWK as a viable option for dividend-focused portfolios, maintaining an awareness of cash-related metrics.
Smart Data Insight
Master the Perfect Entry & Exit for this Stock
Don't leave your profits to chance. Historically, this stock follows specific seasonal patterns that institutional traders use to maximize returns.
- ✅ Identify the "Golden Buying Window"
- ✅ Avoid high-risk correction cycles
- ✅ Backtested data from the last 20+ years