August 10, 2025 a 03:31 am


AWK: Dividend Analysis - American Water Works Company, Inc.
American Water Works Company, Inc. (AWK) presents a reliable investment opportunity with a strong dividend history and a consistent yield. Despite challenges in free cash flow, the overall growth trajectory points towards steady dividend growth. The company maintains a robust payout policy, reflected in its historical payout ratios, signaling confidence in its income-generating capabilities.
📊 Overview
American Water Works operates in the critical Utilities sector, delivering water and wastewater services. This sector is known for its stability, which is reflected in the company’s steady dividend profile and market performance.
| Metric | Details |
|---|---|
| Sector | Utilities |
| Dividend Yield | 2.19% |
| Current Dividend Per Share | 3 USD |
| Dividend History | 18 years |
| Last Cut or Suspension | None |
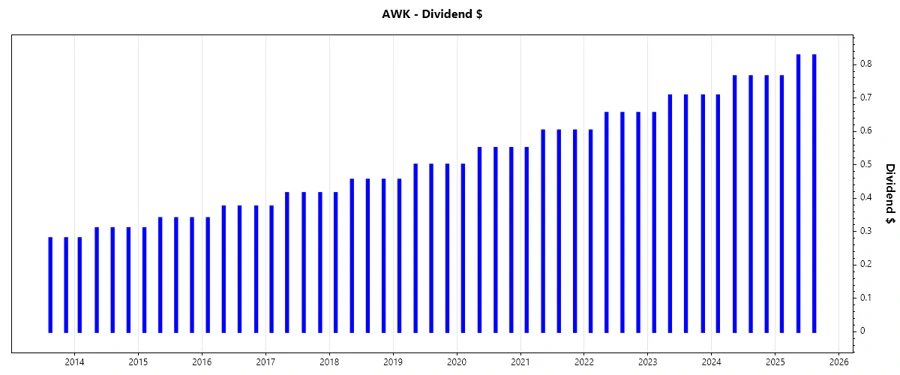
📈 Dividend History
A strong and extensive dividend history underscores American Water Works Company’s dedication to providing shareholder value. This stability ensures investor confidence and provides predictability in income, especially during uncertain market conditions.
| Year | Dividend Per Share (USD) |
|---|---|
| 2025 | 2.42 |
| 2024 | 3.00 |
| 2023 | 2.78 |
| 2022 | 2.57 |
| 2021 | 2.36 |
🔺 Dividend Growth
The evolution of dividend payments indicates a measured yet promising growth pattern. The dividend growth trends serve as an indicator of the company’s ability to increase shareholder returns sustainably over time.
| Time | Growth |
|---|---|
| 3 years | 8.40% |
| 5 years | 8.96% |
The average dividend growth is 8.96% over 5 years. This shows moderate but steady dividend growth.
🗣️ Payout Ratio
Payout ratios are crucial for assessing dividend sustainability. The EPS-based ratio of 54.02% showcases efficient earnings reinvestment, while the negative FCF-based ratio highlights areas of concern, specifically in cash flow management that need addressing.
| Key figure | Ratio |
|---|---|
| EPS-based | 54.02% |
| Free cash flow-based | -61.44% |
💡 Cashflow & Capital Efficiency
Understanding cash flow and capital efficiency is vital to gauging a company's operational health and its ability to generate returns on investment.
| Year | 2024 | 2023 | 2022 |
|---|---|---|---|
| Free Cash Flow Yield | -3.34% | -3.38% | -4.73% |
| Earnings Yield | 4.33% | 3.71% | 2.96% |
| CAPEX to Operating Cash Flow | 140.66% | 145.89% | 218.41% |
| Stock-based Compensation to Revenue | 0 | 0.59% | 0.74% |
| Free Cash Flow / Operating Cash Flow Ratio | -39.66% | -45.89% | -118.41% |
The figures reflect challenges in the company’s free cash flow management, necessitating strategies to optimize cash allocation and improve financial health.
🕵️ Balance Sheet & Leverage Analysis
Analyzing balance sheet ratios provides insight into the financial stability and leverage status of American Water Works Company.
| Year | 2024 | 2023 | 2022 |
|---|---|---|---|
| Debt-to-Equity Ratio | 1.37 | 1.27 | 1.62 |
| Debt-to-Assets Ratio | 43.98% | 41.07% | 44.81% |
| Debt-to-Capital Ratio | 57.73% | 55.95% | 61.81% |
| Net Debt to EBITDA | 5.25 | 5.13 | 6.19 |
| Current Ratio | 0.35 | 0.65 | 0.44 |
| Quick Ratio | 0.35 | 0.59 | 0.41 |
| Financial Leverage Ratio | 3.18 | 3.09 | 3.61 |
While leverage ratios are on the higher side, indicating a reliance on debt financing, American Water Works maintains a manageable interest coverage, helping to sustain its leverage strategy.
⚙️ Fundamental Strength & Profitability
Profitability measures like ROE and margins are critical in assessing the core business strength and efficiency of American Water Works Company.
| Year | 2024 | 2023 | 2022 |
|---|---|---|---|
| Return on Equity (ROE) | 10.17% | 9.64% | 10.66% |
| Return on Assets (ROA) | 3.20% | 3.12% | 2.95% |
| Net Margin | 22.44% | 22.30% | 21.62% |
| EBIT Margin | 40.18% | 39.11% | 35.60% |
| EBITDA Margin | 57.00% | 55.74% | 52.72% |
| Gross Margin | 60.33% | 59.38% | 58.10% |
The company’s trend in profitability suggests a stable operating environment, enabling good returns on equity and reasonable margins, aiding dividend sustainability.
🔍 Price Development
🧮 Dividend Scoring System
| Category | Score (1-5) | Result |
|---|---|---|
| Dividend Yield | 4 | |
| Dividend Stability | 5 | |
| Dividend Growth | 4 | |
| Payout Ratio | 3 | |
| Financial Stability | 3 | |
| Dividend Continuity | 5 | |
| Cashflow Coverage | 2 | |
| Balance Sheet Quality | 3 |
Total Score: 29/40
✅ Rating
Based on the comprehensive analysis, American Water Works Company, Inc. is recommended as a moderate buy for dividend-focused investors. With a strong track record in dividend payments and stability in underlying operations, the company provides a reliable investment opportunity, albeit with considerations for cash flow improvements.
Smart Data Insight
Master the Perfect Entry & Exit for this Stock
Don't leave your profits to chance. Historically, this stock follows specific seasonal patterns that institutional traders use to maximize returns.
- ✅ Identify the "Golden Buying Window"
- ✅ Avoid high-risk correction cycles
- ✅ Backtested data from the last 20+ years