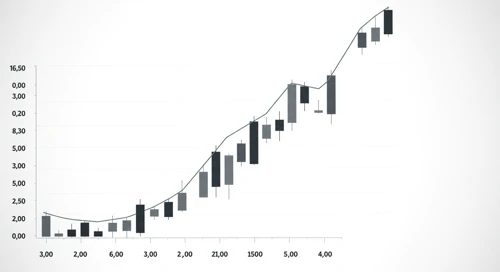
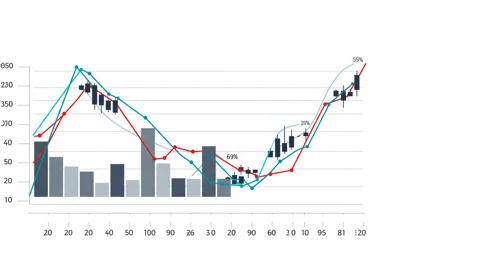
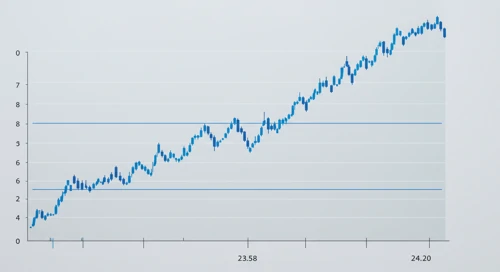
GPN: Trend with Support and Resistance Levels - Global Payments Inc
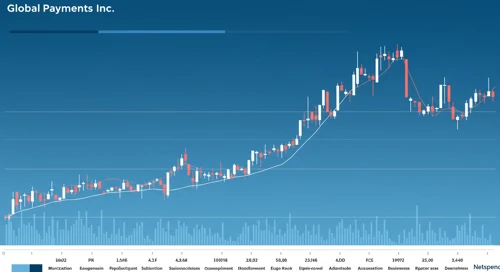
GPN: Current price trend is evaluated alongside key support and resistance level. View of potential turning points and price momentum.
July 25, 2026 a 09:03 am
TSN: Analysts Ratings - Tyson Foods Inc

TSN: Comprehensive breakdown of current and historical analyst ratings, offering insights into how expert sentiment has evolved over time.
July 25, 2026 a 09:00 am
BRK B: Analysts Ratings - Berkshire Hathaway Inc

BRK-B: Comprehensive breakdown of current and historical analyst ratings, offering insights into how expert sentiment has evolved over time.
July 25, 2026 a 08:38 am
ANET: Fundamental Ratio Analysis - Arista Networks Inc
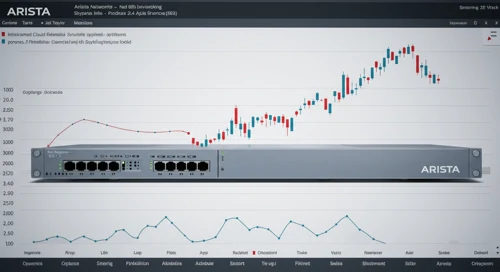
ANET: Evaluation of key financial ratios, analyst ratings, and price targets. A data-driven perspective on the valuation and market expectations.
July 25, 2026 a 08:00 am
HAL: Dividend Analysis - Halliburton Company
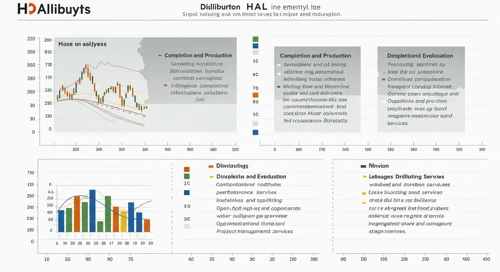
HAL: In-depth analysis of a company's dividend stability and key fundamental ratios to assess its financial strength and long-term investment potential.
July 25, 2026 a 07:46 am
SBUX: Fundamental Ratio Analysis - Starbucks Corporation
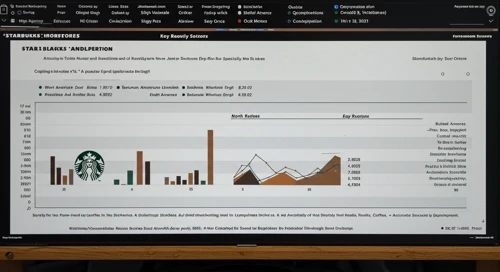
SBUX: Evaluation of key financial ratios, analyst ratings, and price targets. A data-driven perspective on the valuation and market expectations.
July 25, 2026 a 07:43 am
KIM: Dividend Analysis - Kimco Realty Corporation
KIM: In-depth analysis of a company's dividend stability and key fundamental ratios to assess its financial strength and long-term investment potential.
July 25, 2026 a 07:31 am

Crypto Comparison. 25 Jul
July 25, 2026 a 12:31 pm
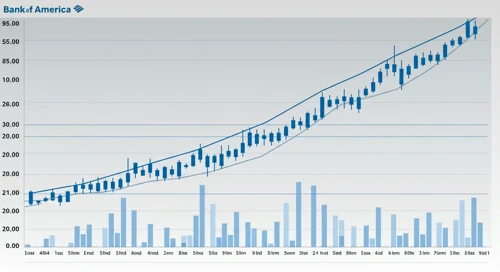
BAC: Fibunacci Level Technical Analysis - Bank of America Corporation
July 25, 2026 a 11:44 am

SPGI: Fundamental Ratio Analysis - SandP Global Inc
July 25, 2026 a 11:43 am
EG: Fibunacci Level Technical Analysis - Everest Group Ltd
July 25, 2026 a 10:15 am
BKR: Fibunacci Level Technical Analysis - Baker Hughes Company
BKR: Fibonacci retracement levels to identify key potential support and resistance zones, based on recent price trends.
July 25, 2026 a 06:44 am
MRK: Fibunacci Level Technical Analysis - Merck and Co Inc
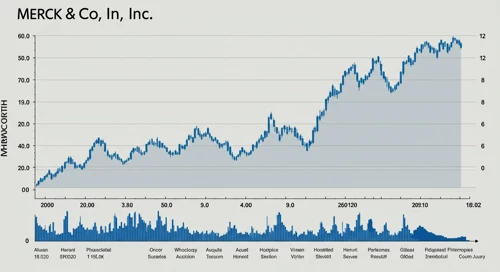
MRK: Fibonacci retracement levels to identify key potential support and resistance zones, based on recent price trends.
July 25, 2026 a 05:15 am
GBPCAD: Fibunacci Level Technical Analysis
GBPCAD: Fibonacci retracement levels to identify key potential support and resistance zones, based on recent price trends.
July 25, 2026 a 05:08 am
CADJPY: Trend with Support and Resistance Levels
CADJPY: Current price trend is evaluated alongside key support and resistance level. View of potential turning points and price momentum.
July 25, 2026 a 04:28 am
AES: Trend with Support and Resistance Levels - The AES Corporation
AES: Current price trend is evaluated alongside key support and resistance level. View of potential turning points and price momentum.
July 25, 2026 a 04:03 am
STT: Dividend Analysis - State Street Corporation
STT: In-depth analysis of a company's dividend stability and key fundamental ratios to assess its financial strength and long-term investment potential.
July 25, 2026 a 03:31 am
TYL: Trend with Support and Resistance Levels - Tyler Technologies Inc
TYL: Current price trend is evaluated alongside key support and resistance level. View of potential turning points and price momentum.
July 25, 2026 a 03:15 am
Stock Market - Heatmap
Use mouse wheel to zoom in and out. Click a ticker to display detailed information in a new window. Hover mouse cursor over a ticker to see more data.
Stock's
TRGP: Analysts Ratings - Targa Resources Corp
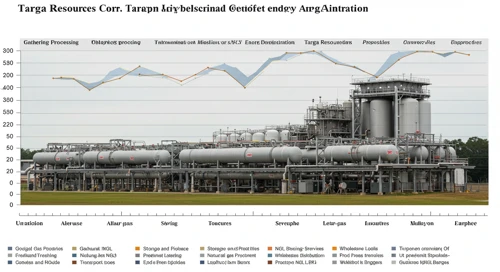
TRGP: Comprehensive breakdown of current and historical analyst ratings, offering insights into how expert sentiment has evolved over time.
July 24, 2026 a 05:00 pm
CHTR: Fibunacci Level Technical Analysis - Charter Communications Inc
CHTR: Fibonacci retracement levels to identify key potential support and resistance zones, based on recent price trends.
July 24, 2026 a 04:44 pm
SPG: Analysts Ratings - Simon Property Group Inc
SPG: Comprehensive breakdown of current and historical analyst ratings, offering insights into how expert sentiment has evolved over time.
July 24, 2026 a 04:38 pm
KHC: Fundamental Ratio Analysis - The Kraft Heinz Company

KHC: Evaluation of key financial ratios, analyst ratings, and price targets. A data-driven perspective on the valuation and market expectations.
July 24, 2026 a 03:43 pm
BIIB: Fibunacci Level Technical Analysis - Biogen Inc
BIIB: Fibonacci retracement levels to identify key potential support and resistance zones, based on recent price trends.
July 24, 2026 a 03:15 pm
NOC: Trend with Support and Resistance Levels - Northrop Grumman Corporation

NOC: Current price trend is evaluated alongside key support and resistance level. View of potential turning points and price momentum.
July 24, 2026 a 02:03 pm
OTIS: Trend with Support and Resistance Levels - Otis Worldwide Corporation

OTIS: Current price trend is evaluated alongside key support and resistance level. View of potential turning points and price momentum.
July 24, 2026 a 01:15 pm

DIS: Analysts Ratings - The Walt Disney Company
July 24, 2026 a 09:00 pm
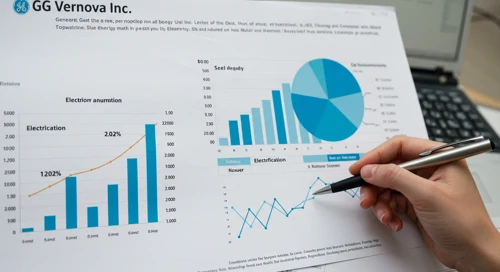
GEV: Analysts Ratings - GE Vernova Inc
July 24, 2026 a 08:38 pm

SW: Fundamental Ratio Analysis - Smurfit Westrock plc
July 24, 2026 a 07:43 pm
GIS: Fundamental Ratio Analysis - General Mills Inc
July 24, 2026 a 06:00 pm
NEE: Fundamental Ratio Analysis - NextEra Energy Inc

NEE: Evaluation of key financial ratios, analyst ratings, and price targets. A data-driven perspective on the valuation and market expectations.
July 24, 2026 a 01:00 pm
BKNG: Analysts Ratings - Booking Holdings Inc
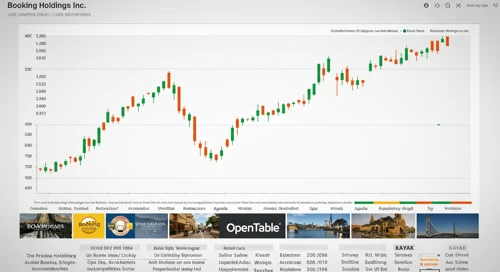
BKNG: Comprehensive breakdown of current and historical analyst ratings, offering insights into how expert sentiment has evolved over time.
July 24, 2026 a 01:00 pm
AFL: Dividend Analysis - Aflac Incorporated
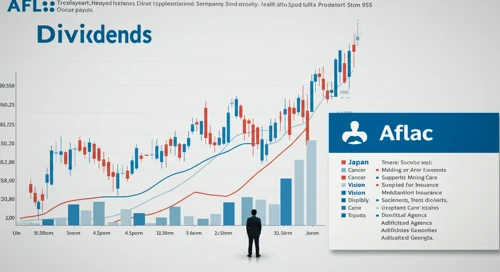
AFL: In-depth analysis of a company's dividend stability and key fundamental ratios to assess its financial strength and long-term investment potential.
July 24, 2026 a 12:46 pm
TRMB: Analysts Ratings - Trimble Inc
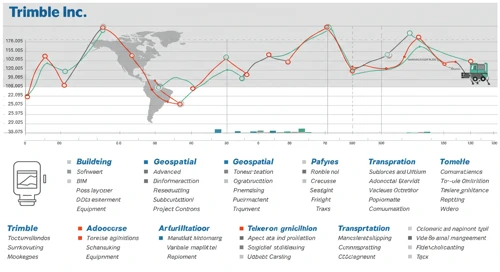
TRMB: Comprehensive breakdown of current and historical analyst ratings, offering insights into how expert sentiment has evolved over time.
July 24, 2026 a 12:38 pm
EMR: Fibunacci Level Technical Analysis - Emerson Electric Co
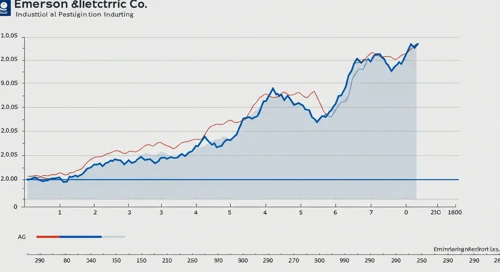
EMR: Fibonacci retracement levels to identify key potential support and resistance zones, based on recent price trends.
July 24, 2026 a 11:44 am
MPWR: Fundamental Ratio Analysis - Monolithic Power Systems Inc
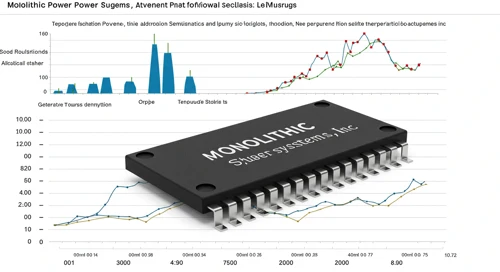
MPWR: Evaluation of key financial ratios, analyst ratings, and price targets. A data-driven perspective on the valuation and market expectations.
July 24, 2026 a 11:43 am
CBRE: Fibunacci Level Technical Analysis - CBRE Group Inc
CBRE: Fibonacci retracement levels to identify key potential support and resistance zones, based on recent price trends.
July 24, 2026 a 10:15 am
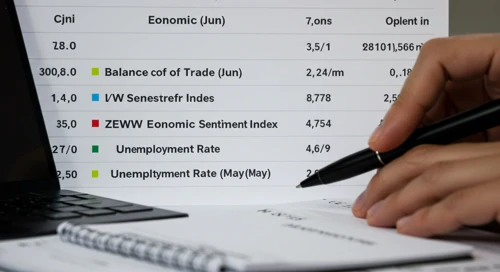
Economic Calendar
Currencies
AUDNZD: Fibunacci Level Technical Analysis
AUDNZD: Fibonacci retracement levels to identify key potential support and resistance zones, based on recent price trends.
July 23, 2026 a 05:08 am
CADCHF: Trend with Support and Resistance Levels
CADCHF: Current price trend is evaluated alongside key support and resistance level. View of potential turning points and price momentum.
July 23, 2026 a 04:28 am
Important Key Figures of the last Days
Overview of key economic indicators released over the past days, highlighting their potential impact on markets and investor sentiment.
July 23, 2026 a 02:31 am
Todays Important Key Figures 22 Jul

Today’s important economic data releases – a snapshot of key indicators influencing markets and shaping financial expectations.
July 22, 2026 a 07:00 pm
GBPSEK: Fibunacci Level Technical Analysis
GBPSEK: Fibonacci retracement levels to identify key potential support and resistance zones, based on recent price trends.
July 22, 2026 a 05:08 am
EURJPY: Trend with Support and Resistance Levels
EURJPY: Current price trend is evaluated alongside key support and resistance level. View of potential turning points and price momentum.
July 22, 2026 a 04:28 am
Todays Important Key Figures 21 Jul
Today’s important economic data releases – a snapshot of key indicators influencing markets and shaping financial expectations.
July 21, 2026 a 07:00 pm
Todays Important Key Figures 25 Jul
July 24, 2026 a 11:00 pm

Todays Important Key Figures 24 Jul
July 24, 2026 a 07:00 pm
EURGBP: Fibunacci Level Technical Analysis
July 24, 2026 a 05:08 am

Todays Important Key Figures 23 Jul
July 23, 2026 a 07:00 pm
GBPJPY: Fibunacci Level Technical Analysis
GBPJPY: Fibonacci retracement levels to identify key potential support and resistance zones, based on recent price trends.
July 21, 2026 a 05:08 am
AUDUSD: Trend with Support and Resistance Levels
AUDUSD: Current price trend is evaluated alongside key support and resistance level. View of potential turning points and price momentum.
July 21, 2026 a 04:28 am
Important Key Figures of the last Days

Overview of key economic indicators released over the past days, highlighting their potential impact on markets and investor sentiment.
July 21, 2026 a 02:31 am
Todays Important Key Figures 20 Jul

Today’s important economic data releases – a snapshot of key indicators influencing markets and shaping financial expectations.
July 20, 2026 a 07:00 pm
EURCHF: Fibunacci Level Technical Analysis
EURCHF: Fibonacci retracement levels to identify key potential support and resistance zones, based on recent price trends.
July 20, 2026 a 05:08 am
EURUSD: Trend with Support and Resistance Levels
EURUSD: Current price trend is evaluated alongside key support and resistance level. View of potential turning points and price momentum.
July 20, 2026 a 04:28 am
GBPAUD: Fibunacci Level Technical Analysis
GBPAUD: Fibonacci retracement levels to identify key potential support and resistance zones, based on recent price trends.
July 19, 2026 a 05:08 am
Currencies