May 13, 2026 a 03:15 am
AVY: Trend and Support & Resistance Analysis - Avery Dennison Corporation
Avery Dennison Corporation has shown recent volatility in its stock prices, reflecting its dynamic business environment. The company, active in pressure-sensitive materials and product markets globally, faces challenges and opportunities from various economic factors. The recent analysis indicates a prevailing downtrend, but potential support levels may offer buying opportunities. Investors should closely monitor macroeconomic indicators and market demand in key sectors.
Trend Analysis
| Date | Close Price | Trend |
|---|---|---|
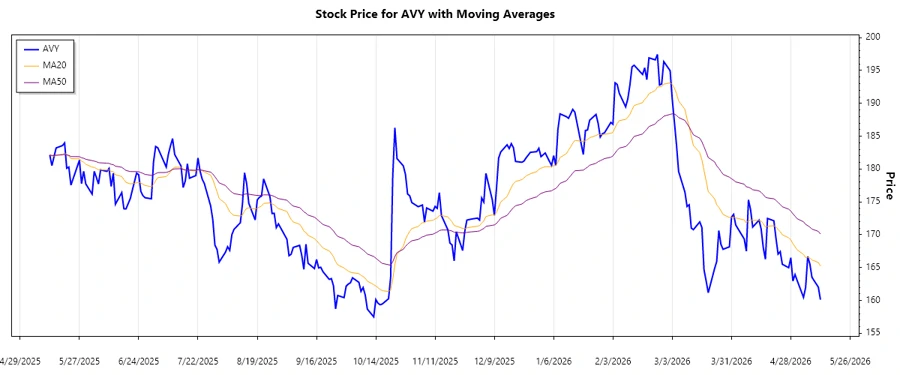
| 2026-05-12 | 160.11 | ▼ Downtrend |
| 2026-05-11 | 162.02 | ▼ Downtrend |
| 2026-05-08 | 163.51 | ▼ Downtrend |
| 2026-05-07 | 165.53 | ▼ Downtrend |
| 2026-05-06 | 166.68 | ▼ Downtrend |
| 2026-05-05 | 161.97 | ▼ Downtrend |
| 2026-05-04 | 160.46 | ▼ Downtrend |
The calculated EMAs indicate a persistent downward trend as EMA20 has consistently stayed below EMA50. This suggests sustained bearish sentiment in the market.
Support and Resistance
| Zone Type | From | To |
|---|---|---|
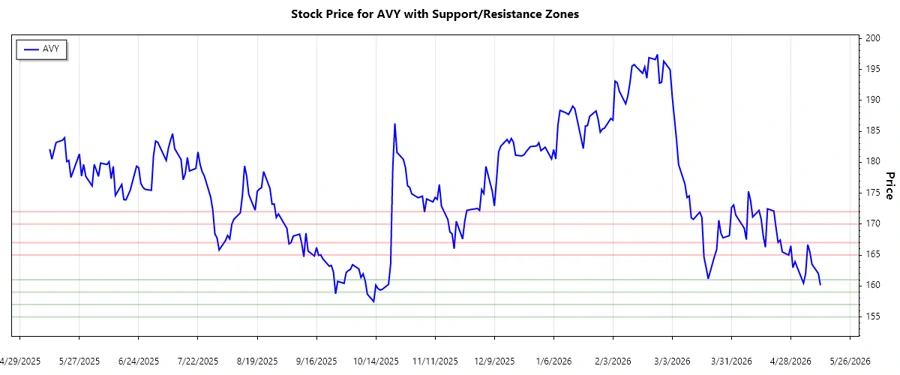
| Support Zone 1 | 159.00 | 161.00 |
| Support Zone 2 | 155.00 | 157.00 |
| Resistance Zone 1 | 165.00 | 167.00 |
| Resistance Zone 2 | 170.00 | 172.00 |
The current stock price is close to the first support zone, indicating a potential rebound if buying interest increases.
Conclusion
The Avery Dennison Corporation stock currently experiences a bearish trend, with prices testing critical support levels. This situation offers a mixed outlook where downside risks prevail, yet there is opportunity for recovery should fundamental outcomes improve. Analysts should monitor economic cues and industry trends, as these will significantly influence the company's stock movement. Additionally, navigating through volatile phases requires attention to emerging support or resistance confirmations, reflecting the dynamic global market in which Avery Dennison operates.
Smart Data Insight
Master the Perfect Entry & Exit for this Stock
Don't leave your profits to chance. Historically, this stock follows specific seasonal patterns that institutional traders use to maximize returns.
- ✅ Identify the "Golden Buying Window"
- ✅ Avoid high-risk correction cycles
- ✅ Backtested data from the last 20+ years