October 07, 2025 a 09:03 am
AVY: Trend and Support & Resistance Analysis - Avery Dennison Corporation
The recent analysis of Avery Dennison Corporation's stock demonstrates volatility within a broader downward movement. The company's diverse product range and global presence provide resilience, yet current market conditions exhibit a downward pressure on the stock price. The technical indicators show a cautious approach is advisable for the near-term investing horizon.
Trend Analysis
| Date | Close Price | Trend |
|---|---|---|
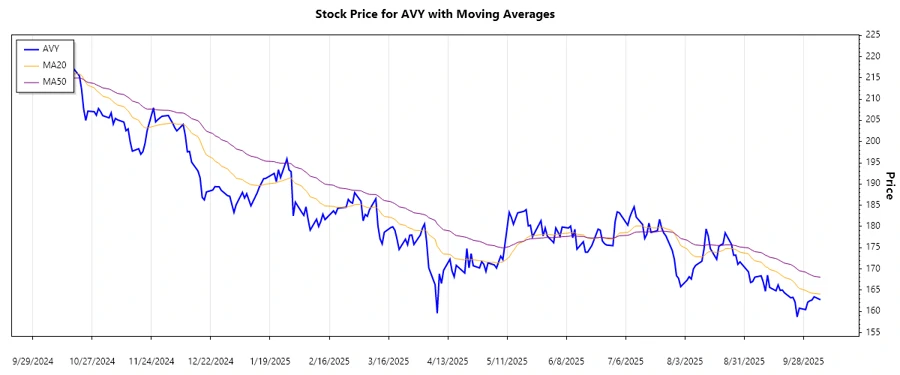
| 2025-10-06 | 162.75 | ▼ |
| 2025-10-03 | 163.44 | ▼ |
| 2025-10-02 | 162.68 | ▼ |
| 2025-10-01 | 162.49 | ▼ |
| 2025-09-30 | 162.17 | ▼ |
| 2025-09-29 | 160.42 | ▼ |
| 2025-09-26 | 160.75 | ▼ |
Based on the current trend, the stock is in a clear downward trajectory as evidenced by the closing prices. The EMA20 is below the EMA50, indicating a sustained downward momentum in the short to medium term.
Support and Resistance
| Zone Type | From | To |
|---|---|---|
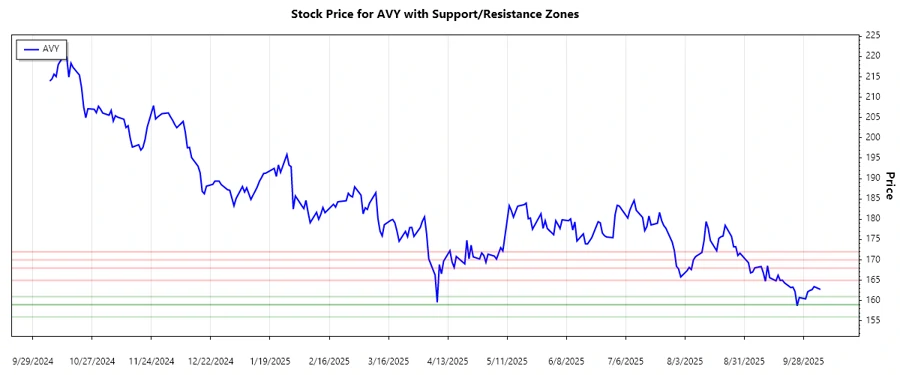
| Support | 159.00 | 161.00 |
| Support | 156.00 | 159.00 |
| Resistance | 165.00 | 168.00 |
| Resistance | 170.00 | 172.00 |
The current closing price of 162.75 lies just above the primary support zone. This suggests further potential for breakdown should the downward momentum continue, potentially inviting a test of the lower support levels.
Conclusion
The current technical indicators suggest that Avery Dennison is experiencing a downward trend with potential for continued pressure on lower support zones. The robust product portfolio and international presence provide a fundamental cushion, but immediate technical signals warrant caution. Analysts should keep an eye on the support levels, as breaches could indicate further downside, whereas any developments that push the stock past resistance may signal potential recovery. Investors are advised to consider hedging or diversifying strategies to mitigate risks associated with this current trend.
Smart Data Insight
Master the Perfect Entry & Exit for this Stock
Don't leave your profits to chance. Historically, this stock follows specific seasonal patterns that institutional traders use to maximize returns.
- ✅ Identify the "Golden Buying Window"
- ✅ Avoid high-risk correction cycles
- ✅ Backtested data from the last 20+ years