
June 24, 2026 a 07:43 am
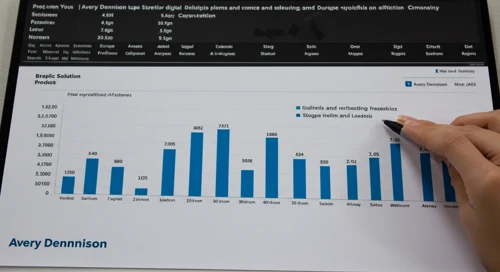

AVY: Fundamental Ratio Analysis - Avery Dennison Corporation
The Avery Dennison Corporation is a key player in the materials science and digital identification solutions sector. Currently, its stock (AVY) shows robust fundamentals with a moderate overall score, suggesting a stable financial standing. Investors should recognize its strong presence in various markets across the globe.
Fundamental Rating
The fundamental rating highlights the strengths and weaknesses of the company's financial health.
| Category | Score | Visual |
|---|---|---|
| Discounted Cash Flow | 4 | |
| Return on Equity | 5 | |
| Return on Assets | 5 | |
| Debt to Equity | 1 | |
| Price to Earnings | 2 | |
| Price to Book | 1 |
Historical Rating
An overview of the company's past scores, showing progress or decline.
| Date | Overall | DCF | ROE | ROA | D/E | P/E | P/B |
|---|---|---|---|---|---|---|---|
| 2026-06-23 | 3 | 4 | 5 | 5 | 1 | 2 | 1 |
| Previous Date | 0 | 4 | 5 | 5 | 1 | 2 | 1 |
Analyst Price Targets
Analyst expectations provide insight into potential future market valuation.
| High | Low | Median | Consensus |
|---|---|---|---|
| 224 | 175 | 221 | 206.8 |
Analyst Sentiment
The sentiment among analysts reflects general opinion and recommendation trends.
| Recommendation | Count | Visual |
|---|---|---|
| Strong Buy | 0 | |
| Buy | 13 | |
| Hold | 5 | |
| Sell | 0 | |
| Strong Sell | 0 |
Conclusion
Avery Dennison Corporation stands out with its diversified product offerings and global presence. Despite a few challenges in debt management, its strong performance metrics like ROE and ROA provide a solid foundation. The analyst consensus suggests a “Buy” sentiment, supported by a stable outlook in fundamental ratings. Investors should weigh the opportunities in its innovative product segment against current debt levels. Overall, the corporation's stock appears to be a prudent choice for those seeking long-term growth.
Smart Data Insight
Master the Perfect Entry & Exit for this Stock
Don't leave your profits to chance. Historically, this stock follows specific seasonal patterns that institutional traders use to maximize returns.
- ✅ Identify the "Golden Buying Window"
- ✅ Avoid high-risk correction cycles
- ✅ Backtested data from the last 20+ years