January 10, 2026 a 12:46 pm
AVY: Dividend Analysis - Avery Dennison Corporation
Avery Dennison Corporation presents a promising dividend profile with a consistent history of payments, making it an attractive option for income-focused investors. With a solid stance in its sector, the company demonstrates moderate dividend growth and a reasonable payout ratio, suggesting sustained financial health. However, the relatively modest dividend yield may indicate limited immediate income potential, necessitating a balance between capital gains and dividend income for investors.
📊 Overview
A comprehensive understanding of Avery Dennison's dividend metrics showcases its positioning within the sector. A stable dividend yield combined with a long history of uninterrupted payouts highlights the company's commitment to returning value to shareholders.
| Metric | Value |
|---|---|
| Sector | Industrials |
| Dividend yield | 2.11 % |
| Current dividend per share | 3.45 USD |
| Dividend history | 40 years |
| Last cut or suspension | 2010 |
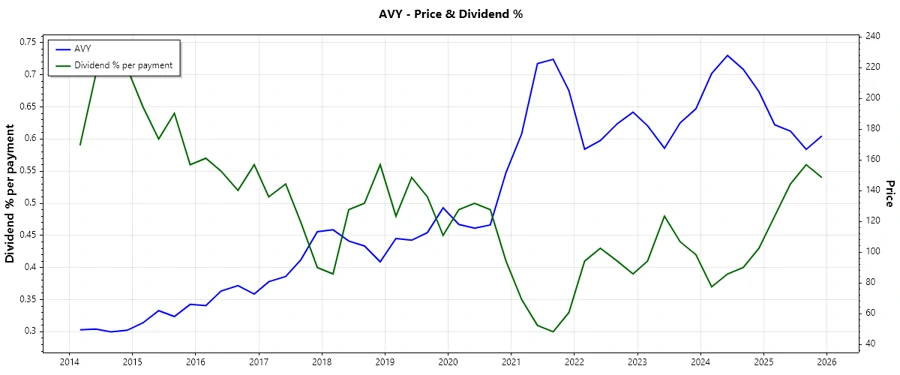
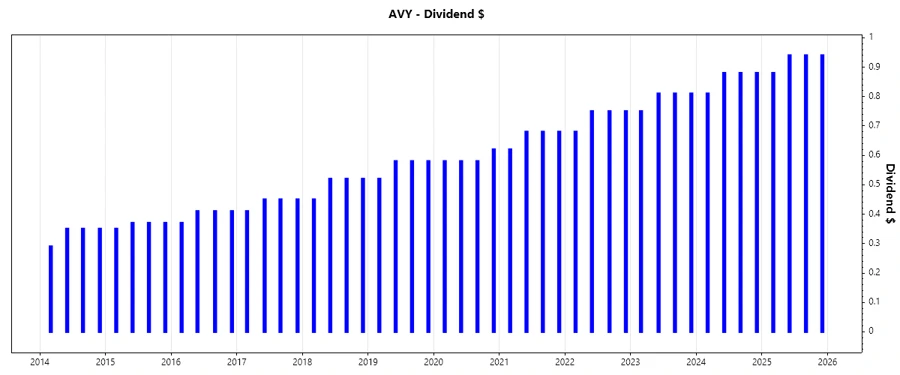
🗣️ Dividend History
The dividend history of Avery Dennison is a testament to its strong financial foundation, with over four decades of continuous payments. This historical stability is reassuring for dividend-seeking investors, indicating robust cash flow management.
| Year | Dividend per Share (USD) |
|---|---|
| 2025 | 3.70 |
| 2024 | 3.45 |
| 2023 | 3.18 |
| 2022 | 2.93 |
| 2021 | 2.66 |
📈 Dividend Growth
The examination of Avery Dennison's dividend growth reveals a steady upward trend over recent years. This consistent growth trajectory augments investor confidence, signifying the company's ability to enhance shareholder value progressively.
| Time | Growth |
|---|---|
| 3 years | 8.09 % |
| 5 years | 9.41 % |
The average dividend growth is 9.41 % over 5 years. This shows moderate but steady dividend growth.
⚠️ Payout Ratio
Analyzing Avery Dennison's payout ratios offers insight into its capacity to distribute dividends sustainably. The EPS-based and FCF-based payout ratios falling below 40% reflect a balanced approach to earnings and cash flow management.
| Key figure | Ratio |
|---|---|
| EPS-based | 38.73 % |
| Free cash flow-based | 38.98 % |
The payout ratio indicates a prudent strategy, with EPS at 38.73 % and FCF at 38.98 %, suggesting sufficient earnings retention for growth and stability.
💰 Cashflow & Capital Efficiency
Cashflow analysis elucidates Avery Dennison's operational efficiency and capital allocation strategies, key to sustained dividend payouts and future growth.
| Metric | 2022 | 2023 | 2024 |
|---|---|---|---|
| Free Cash Flow Yield | 4.49 % | 3.32 % | 4.82 % |
| Earnings Yield | 5.13 % | 3.08 % | 4.65 % |
| CAPEX to Operating Cash Flow | 31.06 % | 34.52 % | 22.24 % |
| Stock-based Compensation to Revenue | 0.52 % | 0.27 % | 0.33 % |
| Free Cash Flow / Operating Cash Flow Ratio | 68.94 % | 65.48 % | 77.76 % |
The Cashflow and Capital Efficiency ratios demonstrate Avery Dennison's adept management of capital resources and operational cash flows, fostering ongoing shareholder returns.
📉 Balance Sheet & Leverage Analysis
This section provides insights into Avery Dennison's financial stability and debt management, crucial for assessing long-term solvency and risk exposure.
| Metric | 2022 | 2023 | 2024 |
|---|---|---|---|
| Debt-to-Equity | 1.53 | 1.52 | 1.36 |
| Debt-to-Assets | 39.02 % | 39.52 % | 37.51 % |
| Debt-to-Capital | 60.42 % | 60.39 % | 57.69 % |
| Net Debt to EBITDA | 2.14 | 2.72 | 2.04 |
| Current Ratio | N/A | N/A | N/A |
| Quick Ratio | 0.63 | 0.69 | 0.73 |
| Financial Leverage | 3.91 | 3.86 | 3.63 |
Leverage metrics suggest manageable debt levels and satisfactory liquidity, maintaining a well-balanced capital structure that supports dividend payments.
✅ Fundamental Strength & Profitability
Fundamental strength gauges Avery Dennison's operational performance and profitability, underpinning its ability to sustain dividend growth amidst varying market conditions.
| Metric | 2022 | 2023 | 2024 |
|---|---|---|---|
| Return on Equity | 37.26 % | 23.64 % | 30.48 % |
| Return on Assets | 9.52 % | 6.13 % | 8.39 % |
| Margins: Net | 8.38 % | 6.01 % | 8.05 % |
| EBIT | 11.99 % | 9.73 % | 12.23 % |
| EBITDA | 15.20 % | 13.30 % | 15.79 % |
| Gross | 26.53 % | 27.19 % | 28.87 % |
| Research & Development to Revenue | 1.51 % | 1.62 % | 0.15 % |
Profitability ratios affirm robust operational effectiveness, with high return metrics demonstrating Avery Dennison's proficiency in leveraging equity and assets into income.
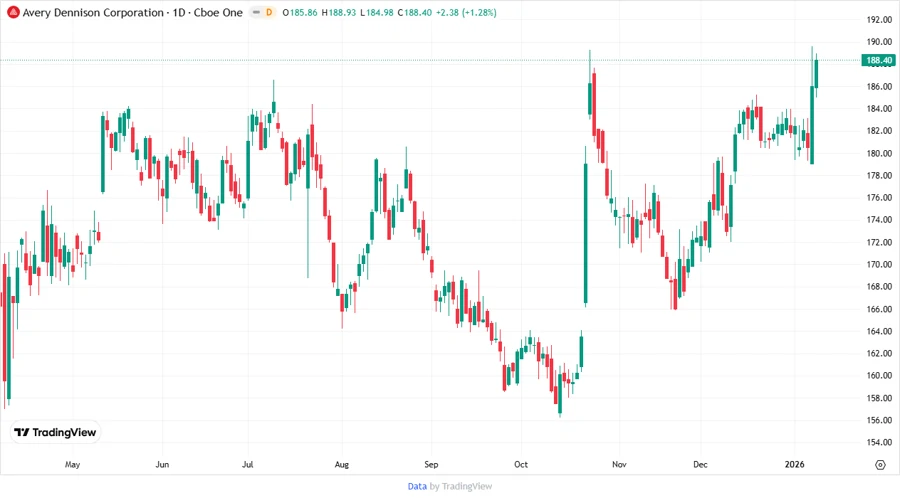
📈 Price Development
🗂️ Dividend Scoring System
| Criteria | Score (1-5) | Score Bar |
|---|---|---|
| Dividend yield | 4 | |
| Dividend Stability | 5 | |
| Dividend growth | 4 | |
| Payout ratio | 4 | |
| Financial stability | 4 | |
| Dividend continuity | 5 | |
| Cashflow Coverage | 4 | |
| Balance Sheet Quality | 4 |
Overall Score: 34/40
🗣️ Rating
In conclusion, Avery Dennison Corporation's dividend profile stands out for its commitment to consistent payments, evidenced by a 40-year history without any recent suspensions. The manageable payout ratios and robust financial metrics suggest a stable and attractive dividend prospect. Investors looking for a prudent blend of income and growth may find Avery Dennison a well-rounded choice, with a high rating in dividend continuity and financial stability.