November 22, 2025 a 03:31 am
AVY: Dividend Analysis - Avery Dennison Corporation
The Avery Dennison Corporation represents a strong dividend play with a 40-year history of consistent payouts. With a current dividend yield of 2.17% and a robust payout supported by solid earnings, it showcases stability and conservative financial management. Despite the modest growth, the company has been reliable in maintaining shareholder returns through dividends.
📊 Overview
| Attribute | Detail |
|---|---|
| Sector | Materials |
| Dividend Yield | 2.17% |
| Current Dividend per Share | 3.45 USD |
| Dividend History | 40 years |
| Last Cut or Suspension | 2010 |
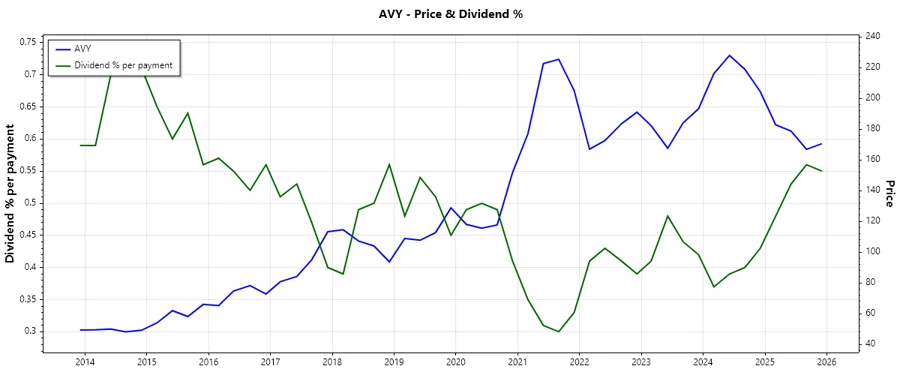
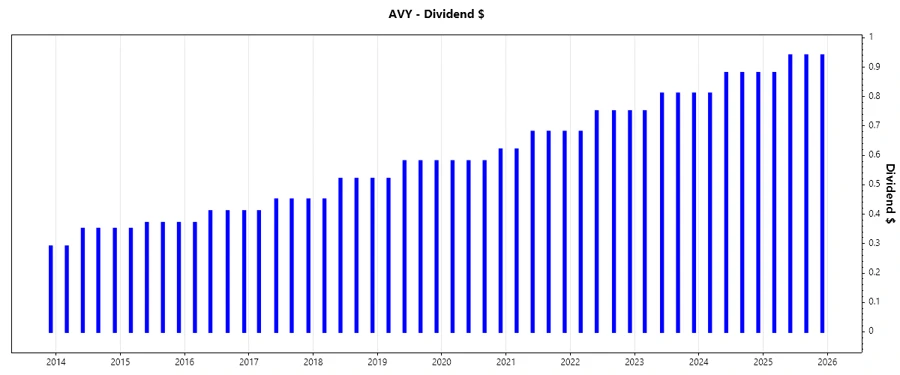
🗣️ Dividend History
Avery Dennison Corporation's long-standing dividend history underscores its commitment to shareholder returns. The past 5 years highlight stable increases, an indicator of both financial health and strategic growth.
| Year | Dividend per Share (USD) |
|---|---|
| 2025 | 3.70 |
| 2024 | 3.45 |
| 2023 | 3.18 |
| 2022 | 2.93 |
| 2021 | 2.66 |
📈 Dividend Growth
Consistent growth in dividends is crucial, as it displays a company’s ability to enhance shareholder wealth over time. Avery Dennison Corporation exhibits a moderate but sustainable growth trend.
| Time | Growth |
|---|---|
| 3 years | 9.06% |
| 5 years | 8.83% |
The average dividend growth is 8.83% over 5 years. This shows moderate but steady dividend growth.
💬 Payout Ratio
A healthy payout ratio reflects the degree to which earnings support dividends, indicating sustainability and room for growth. Sensible management of these ratios will empower companies like Avery Dennison to maintain and grow their payouts.
| Key Figure | Ratio |
|---|---|
| EPS-based | 38.73% |
| Free cash flow-based | 38.98% |
The EPS payout ratio of 38.73% and the FCF payout ratio of 38.98% indicate a secure dividend coverage with sufficient earnings and cash flow backing up these obligations.
💸 Cashflow & Capital Efficiency
Cash flow metrics and capital efficiency are cornerstones for evaluating a company’s operational health and its ability to sustain dividend payouts. Avery Dennison has shown resilience in maintaining a robust capital structure.
| Metric | 2024 | 2023 | 2022 |
|---|---|---|---|
| Free Cash Flow Yield | 4.82% | 3.32% | 4.49% |
| Earnings Yield | 4.65% | 3.08% | 5.13% |
| CAPEX to Operating Cash Flow | 0.22 | 0.35 | 0.31 |
| Stock-based Compensation to Revenue | 0.33% | 0.27% | 0.52% |
| Free Cash Flow / Operating Cash Flow Ratio | 77.76% | 65.48% | 68.94% |
The ever-reliable free cash flow yield and efficient allocation of capital expenditures reflect a stable and well-managed capital efficiency strategy for Avery Dennison.
💪 Balance Sheet & Leverage Analysis
A balance sheet analysis reveals the financial health and recapitalization strategies. Avery Dennison's leverage ratios highlight good handling of obligations while maintaining liquidity.
| Metric | 2024 | 2023 | 2022 |
|---|---|---|---|
| Debt-to-Equity | 1.36 | 1.52 | 1.53 |
| Debt-to-Assets | 0.38 | 0.40 | 0.39 |
| Debt-to-Capital | 0.58 | 0.60 | 0.60 |
| Net Debt to EBITDA | 2.04 | 2.72 | 2.14 |
| Current Ratio | 1.08 | 1.04 | 0.99 |
| Quick Ratio | 0.73 | 0.69 | 0.63 |
| Financial Leverage | 3.63 | 3.86 | 3.91 |
The controlled leverage and sound liquidity positions suggest that Avery Dennison is well-prepared to manage its debt levels efficiently and sustain its dividend policies.
📈 Fundamental Strength & Profitability
Indicators of profitability and fundamental strength underscore the efficiency and operational success of a company. Avery Dennison shows promising financial characteristics and reinforces investor confidence.
| Metric | 2024 | 2023 | 2022 |
|---|---|---|---|
| Return on Equity | 30.48% | 23.64% | 37.26% |
| Return on Assets | 8.39% | 6.13% | 9.52% |
| Profit Margin (Net) | 8.05% | 6.01% | 8.38% |
| EBIT Margin | 12.23% | 9.73% | 11.99% |
| EBITDA Margin | 15.79% | 13.30% | 15.20% |
| Gross Margin | 28.87% | 27.19% | 26.54% |
| R&D to Revenue | 1.57% | 1.62% | 1.51% |
The consistent returns and profit margins affirm solid operational success, positioning Avery Dennison well for ongoing growth and shareholder value enhancement.
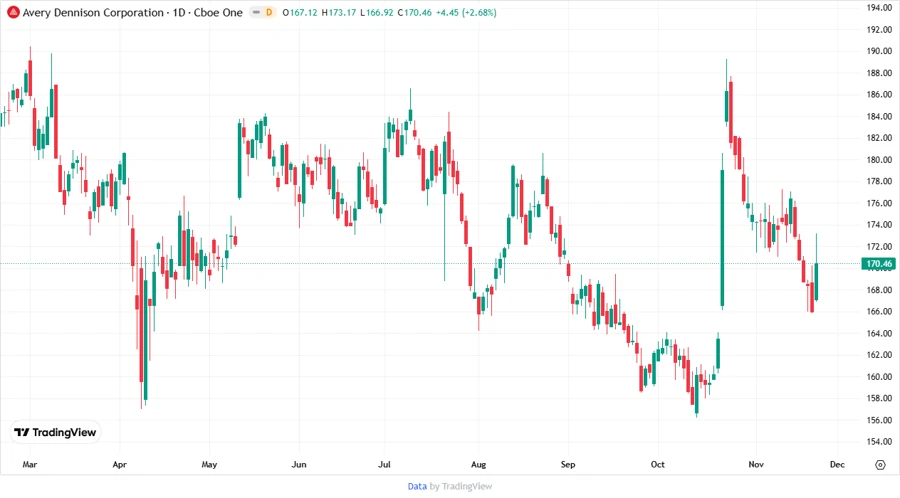
📉 Price Development
✅ Dividend Scoring System
| Criteria | Score | Score Bar |
|---|---|---|
| Dividend yield | 4 | |
| Dividend Stability | 5 | |
| Dividend growth | 3 | |
| Payout ratio | 4 | |
| Financial stability | 4 | |
| Dividend continuity | 5 | |
| Cashflow Coverage | 4 | |
| Balance Sheet Quality | 4 |
Overall Score: 33/40
🌟 Rating
The Avery Dennison Corporation demonstrates an impressive track record of dividend payments, solid payout ratios, and consistent financial metrics. It merits a recommendation for investors seeking a reliable dividend stock with moderate growth potential.
Smart Data Insight
Master the Perfect Entry & Exit for this Stock
Don't leave your profits to chance. Historically, this stock follows specific seasonal patterns that institutional traders use to maximize returns.
- ✅ Identify the "Golden Buying Window"
- ✅ Avoid high-risk correction cycles
- ✅ Backtested data from the last 20+ years