September 02, 2025 a 07:32 am

📊 AVY: Dividend Analysis - Avery Dennison Corporation
Avery Dennison Corporation demonstrates a robust dividend strategy, supported by a long history of dividend payouts and growth. The company's consistent dividend history of 40 years underlines its commitment to returning value to shareholders. With a moderate dividend yield of 2.12%, it provides a balance between stable income and potential capital appreciation.
🗣️ Overview
Avery Dennison, operating in the Specialty Chemicals sector, has established a respectable position with a dividend yield currently at 2.12%. The current dividend per share stands at 3.45 USD, showcasing consistency over 40 years of dividend history. Importantly, there has been no cut or suspension recently, enhancing investor confidence.
| Metric | Details |
|---|---|
| Sector | Specialty Chemicals |
| Dividend yield | 2.12% |
| Current dividend per share | 3.45 USD |
| Dividend history | 40 years |
| Last cut or suspension | None |
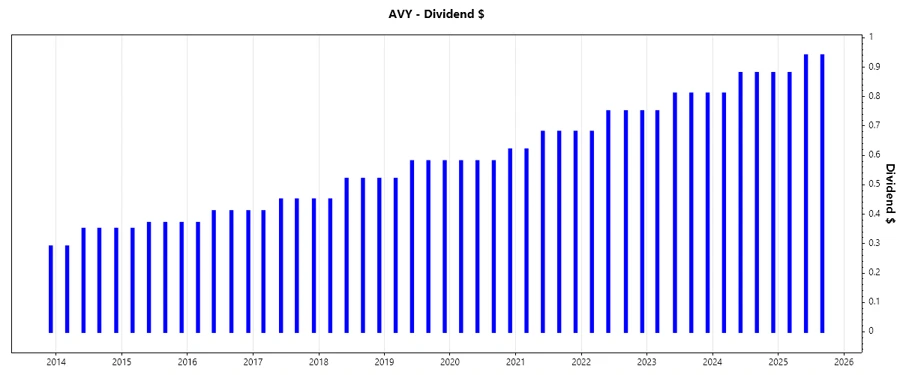
📉 Dividend History
Maintaining a stable dividend payment for 40 consecutive years, Avery Dennison shows reliability in returning profits to shareholders. This longstanding history is a critical factor for conservative investors seeking steady income.
| Year | Dividend per share (USD) |
|---|---|
| 2025 | 2.76 |
| 2024 | 3.45 |
| 2023 | 3.18 |
| 2022 | 2.93 |
| 2021 | 2.66 |
📈 Dividend Growth
Examining dividend growth rates is imperative for assessing future income potential. Avery Dennison boasts an average dividend growth of 8.83% over five years, which indicates a moderate yet stable increment pace.
| Time | Growth |
|---|---|
| 3 years | 9.06% |
| 5 years | 8.83% |
The average dividend growth is 8.83% over 5 years. This shows moderate but steady dividend growth.
✅ Payout Ratio
Payout ratios offer insights into a firm's ability to sustain dividends without compromising its financial health. Avery Dennison's EPS payout ratio of 37.89% and FCF payout ratio of 42.99% suggest a balanced approach to dividends, leaving ample room for growth and reinvestment.
| Key figure | Ratio |
|---|---|
| EPS-based | 37.89% |
| Free cash flow-based | 42.99% |
These payout ratios reflect a prudent dividend policy, ensuring continued growth and stability even during economic downturns.
🏦 Cashflow & Capital Efficiency
The analysis of cash flow and capital efficiency is crucial for understanding the operational strength and sustainability of dividends. Avery Dennison presents a stable cash flow with notable capital efficiency ratios over recent years.
| Metric | 2024 | 2023 | 2022 |
|---|---|---|---|
| Free Cash Flow Yield | 4.82% | 3.32% | 4.49% |
| Earnings Yield | 4.65% | 3.08% | 5.13% |
| CAPEX to Operating Cash Flow | 22.24% | 34.52% | 31.06% |
| Stock-based Compensation to Revenue | 0.33% | 0.00% | 0.52% |
| Free Cash Flow / Operating Cash Flow Ratio | 77.76% | 65.48% | 68.94% |
The data affirms the robust cash flow generation, enabling Avery Dennison to maintain its dividend policies and reinvest capital efficiently.
🔍 Balance Sheet & Leverage Analysis
A strong balance sheet underpins long-term dividend sustainability. Avery Dennison has managed its leverage judiciously, ensuring financial stability.
| Metric | 2024 | 2023 | 2022 |
|---|---|---|---|
| Debt-to-Equity | 136.32% | 152.46% | 152.65% |
| Debt-to-Assets | 37.51% | 39.52% | 39.02% |
| Debt-to-Capital | 57.69% | 60.39% | 60.42% |
| Net Debt to EBITDA | 2.04 | 2.72 | 2.14 |
| Current Ratio | 1.08 | 1.04 | 0.99 |
| Quick Ratio | 0.73 | 0.70 | 0.63 |
| Financial Leverage | 3.63 | 3.86 | 3.91 |
The results suggest that Avery Dennison is managing its debt and leverage effectively, maintaining ample liquidity for operational and strategic needs.
📈 Fundamental Strength & Profitability
Profitability ratios offer insights into a company's efficiency and effectiveness in generating earnings. Avery Dennison's profitability maintains robust with strong fundamentals.
| Metric | 2024 | 2023 | 2022 |
|---|---|---|---|
| Return on Equity | 30.48% | 23.64% | 37.26% |
| Return on Assets | 8.39% | 6.13% | 9.52% |
| Return on Invested Capital | 13.44% | 11.38% | 14.28% |
| Net Profit Margin | 8.05% | 6.01% | 8.38% |
| EBIT Margin | 12.23% | 9.73% | 11.99% |
| EBITDA Margin | 15.79% | 13.30% | 15.20% |
| Gross Margin | 28.90% | 27.23% | 26.60% |
| R&D to Revenue | 1.57% | 1.62% | 1.51% |
This data reinforces Avery Dennison's position as a financially sound organization with solid profitability and effective cost management strategies.
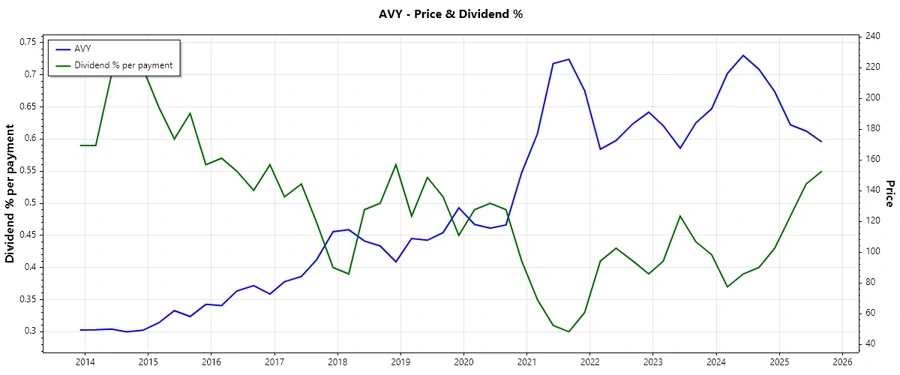
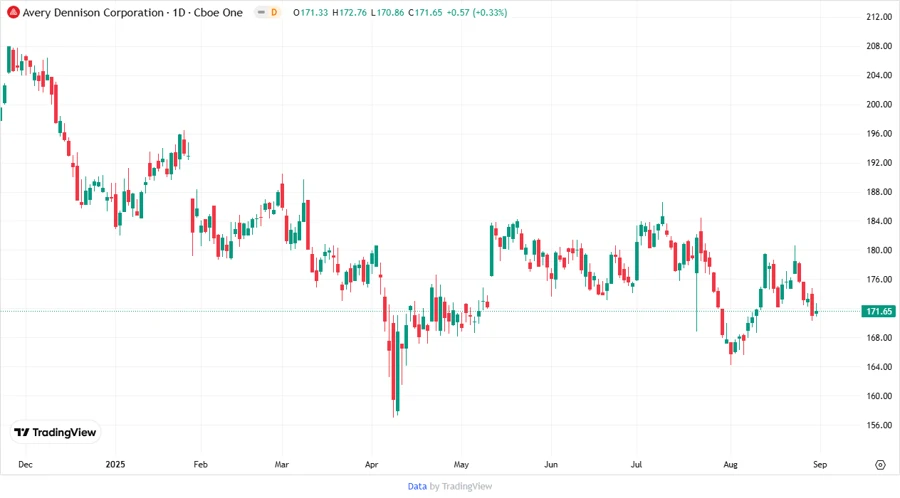
📈 Price Development
✅ Dividend Scoring System
| Criteria | Score | Visualization |
|---|---|---|
| Dividend yield | 4 | |
| Dividend Stability | 5 | |
| Dividend growth | 4 | |
| Payout ratio | 4 | |
| Financial stability | 4 | |
| Dividend continuity | 5 | |
| Cashflow Coverage | 3 | |
| Balance Sheet Quality | 4 |
Total Score: 33/40
📢 Rating
Avery Dennison Corporation receives a strong dividend rating with a total score of 33 out of 40, indicating a well-rounded investment for dividend-seeking investors. The company's historical stability, prudent payout strategy, and financial health offer confidence in the sustainability and potential growth of dividends, making it an appealing choice for long-term investors.
Smart Data Insight
Master the Perfect Entry & Exit for this Stock
Don't leave your profits to chance. Historically, this stock follows specific seasonal patterns that institutional traders use to maximize returns.
- ✅ Identify the "Golden Buying Window"
- ✅ Avoid high-risk correction cycles
- ✅ Backtested data from the last 20+ years