November 14, 2025 a 05:15 am
AVGO: Fibonacci Analysis - Broadcom Inc.
Broadcom Inc. (Ticker: AVGO) has demonstrated a significant upward trend over the past several months. As a leader in semiconductor and infrastructure software, the company's stock has reflected this position with robust performance, underscoring investor confidence. However, high volatility in the tech sector should be considered. Utilizing technical analysis tools like Fibonacci retracement can provide insights into potential price movements.
Fibonacci Analysis
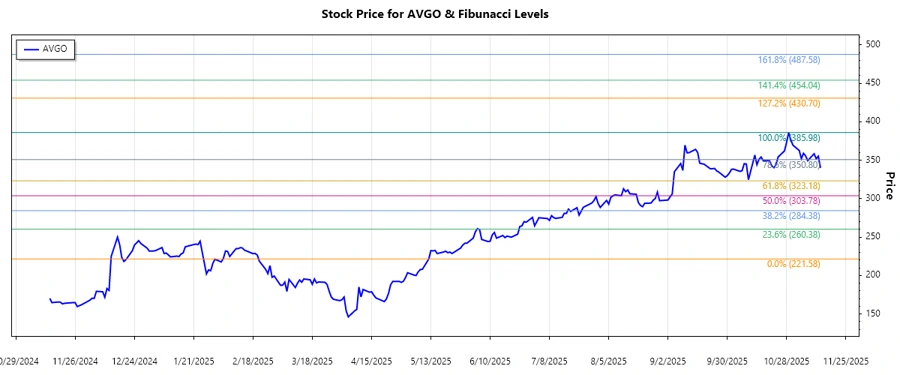
The AVGO stock has experienced a dominant upward trend from mid-May 2025 to mid-November 2025. The technical analysis performed below utilizes Fibonacci retracement levels based on this trend.
| Aspect | Details |
|---|---|
| Trend Period | 2025-05-13 to 2025-10-29 |
| High Point | $385.98 on 2025-10-29 |
| Low Point | $221.58 on 2025-05-12 |
| Fibonacci Levels |
|
| Current Price | $339.98 (near 0.5 retracement level) |
The current price of AVGO is situated near the 0.5 Fibonacci retracement level, suggesting a potential support level at this range. Investors should monitor this zone for further bullish or bearish signals that could validate future price directions.
Conclusion
The upward momentum of AVGO has been largely driven by the increase in demand for semiconductor and infrastructure software solutions. While the 0.5 Fibonacci retracement level suggests a support zone, it is crucial for investors to remain vigilant of market trends and broader economic factors influencing the technology sector. Any significant deviation from the 0.5 level could indicate a change in trend, offering both opportunities and risks. For financial analysts, these levels serve as a guidepost for assessing price action and are vital in strategic decision-making.
Smart Data Insight
Master the Perfect Entry & Exit for this Stock
Don't leave your profits to chance. Historically, this stock follows specific seasonal patterns that institutional traders use to maximize returns.
- ✅ Identify the "Golden Buying Window"
- ✅ Avoid high-risk correction cycles
- ✅ Backtested data from the last 20+ years