October 05, 2025 a 02:47 am
AVGO: Dividend Analysis - Broadcom Inc.
Broadcom Inc. demonstrates a strong dividend profile with consistent payouts over 16 years. Despite a relatively low dividend yield, its historical growth signals potential, yet the payout ratios indicate careful monitoring. With sector-leading fundamentals, Broadcom remains an attractive choice for dividend-focused investors but warrants cautious optimism due to its EPS payout ratio.
📊 Overview
Broadcom Inc. is known for its robust dividend profile within the technology sector. Below are key metrics that characterize its dividend performance:
| Metric | Value |
|---|---|
| Sector | Technology |
| Dividend yield | 0.70% |
| Current dividend per share | 2.12 USD |
| Dividend history | 16 years |
| Last cut or suspension | None |
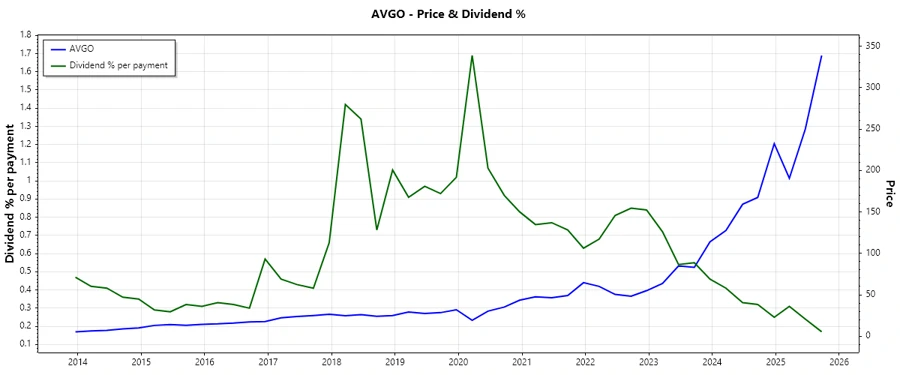
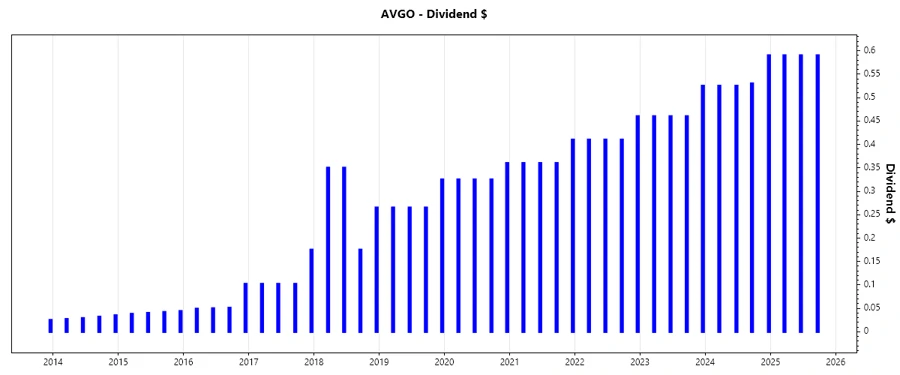
📈 Dividend History
Broadcom's dividend history reflects strong reliability and consistency, crucial for investors banking on steady income. Presidential growth in dividends can solidify investor confidence and promote stock value growth.
| Year | Dividend per Share (USD) |
|---|---|
| 2025 | 1.77 |
| 2024 | 2.17 |
| 2023 | 1.905 |
| 2022 | 1.69 |
| 2021 | 1.49 |
📈 Dividend Growth
A company’s dividend growth provides insight into financial health and shareholder wealth return. The consistency in growth signifies confidence in future earnings.
| Time | Growth |
|---|---|
| 3 years | 13.35% |
| 5 years | 14.14% |
The average dividend growth is 14.14% over 5 years. This shows moderate but steady dividend growth.
📈 Payout Ratio
Payout ratios provide insight into how well dividends are covered by earnings and free cash flow. A balanced ratio supports sustainability and capital reinvestment.
| Key figure | Ratio |
|---|---|
| EPS-based | 52.85% |
| Free cash flow-based | 40.00% |
The payout ratio of 52.85% (EPS) and 40.00% (FCF) indicates a balanced approach, ensuring dividends are sustainable while allowing for reinvestment.
Cashflow & Capital Efficiency
The cash flow and capital efficiency ratios offer insights into cash generation and efficient capital allocation, essential for long-term growth and shareholder value.
| Metric | 2024 | 2023 | 2022 |
|---|---|---|---|
| Free Cash Flow Yield | 0.0249 | 0.0505 | 0.0848 |
| Earnings Yield | 0.0076 | 0.0403 | 0.0598 |
| CAPEX to Operating Cash Flow | 0.0275 | 0.0250 | 0.0253 |
| Stock-based Compensation to Revenue | 0.1113 | 0.0606 | 0.0462 |
| Free Cash Flow / Operating Cash Flow Ratio | 0.973 | 0.975 | 0.975 |
The cashflow stability and efficiency highlight Broadcom's capability to reinvest in revenue-generating assets.
Balance Sheet & Leverage Analysis
Understanding a company's balance sheet health and leverage ratios is crucial for assessing financial risk and the capacity for future debt repayments.
| Metric | 2024 | 2023 | 2022 |
|---|---|---|---|
| Debt-to-Equity | 0.998 | 1.653 | 1.760 |
| Debt-to-Assets | 0.408 | 0.544 | 0.546 |
| Debt-to-Capital | 0.500 | 0.623 | 0.638 |
| Net Debt to EBITDA | 2.438 | 1.239 | 1.439 |
| Current Ratio | 1.174 | 2.815 | 2.624 |
| Quick Ratio | 1.068 | 2.559 | 2.351 |
| Financial Leverage | 2.448 | 3.037 | 3.226 |
The leverage ratios showcase a slight reduction in debt burden over recent years, suggesting improved financial health.
Fundamental Strength & Profitability
These metrics highlight operational efficiency, profitability, and research investment, essential for evaluating potential investment returns.
| Metric | 2024 | 2023 | 2022 |
|---|---|---|---|
| Return on Equity | 0.0871 | 0.5870 | 0.5062 |
| Return on Assets | 0.0356 | 0.1933 | 0.1569 |
| Net Margin | 11.43% | 39.31% | 34.62% |
| EBIT Margin | 26.89% | 46.68% | 42.68% |
| EBITDA Margin | 46.30% | 57.38% | 57.69% |
| Gross Margin | 63.03% | 68.93% | 66.55% |
| Research & Development to Revenue | 17.05% | 14.67% | 14.81% |
Broadcom's profitability metrics point to strong operational efficiency with robust returns on equity and assets.
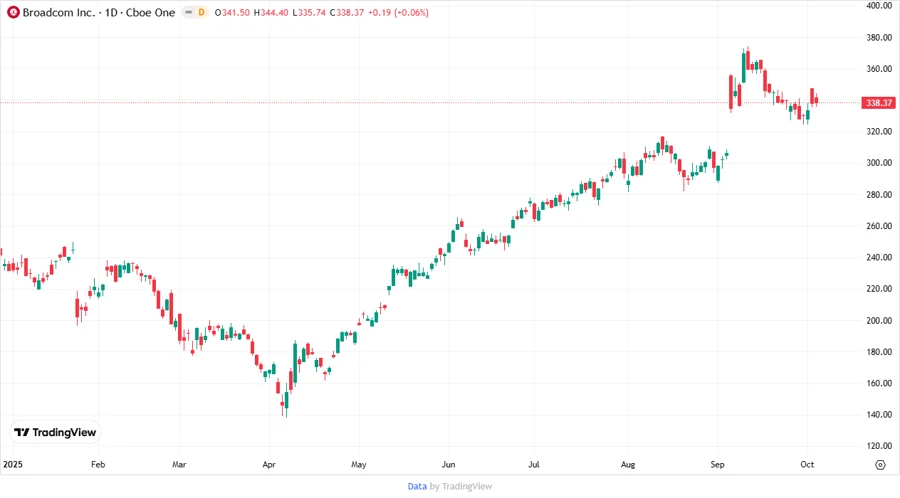
Price Development
🗣️ Dividend Scoring System
| Criteria | Score | Visualization |
|---|---|---|
| Dividend yield | 2 | |
| Dividend Stability | 5 | |
| Dividend Growth | 4 | |
| Payout Ratio | 3 | |
| Financial Stability | 4 | |
| Dividend Continuity | 5 | |
| Cashflow Coverage | 4 | |
| Balance Sheet Quality | 3 |
Total Score: 30/40
🗣️ Rating
Broadcom Inc.'s dividend profile showcases robust stability and moderate growth, making it an attractive choice for income-focused investors. While its yield is currently modest, consistent history and sound payout ratios indicate strong future potential. However, investors should watch for shifts in EPS payout levels to ensure ongoing coverage stability.
Smart Data Insight
Master the Perfect Entry & Exit for this Stock
Don't leave your profits to chance. Historically, this stock follows specific seasonal patterns that institutional traders use to maximize returns.
- ✅ Identify the "Golden Buying Window"
- ✅ Avoid high-risk correction cycles
- ✅ Backtested data from the last 20+ years