September 27, 2025 a 11:32 am
📊 AVGO: Dividend Analysis - Broadcom Inc.
Broadcom Inc., trading under the ticker symbol AVGO, is a leading player in the semiconductor and infrastructure software industry. Known for its consistent dividend payments over the years, Broadcom offers a stable outlook for income-focused investors. While the current dividend yield is modest, there is significant potential for growth given the company's robust financial health and strategic market presence.
🗣️ Overview
Broadcom Inc. operates in the high-tech sector, with a specialized focus on semiconductor and infrastructure software solutions. This solid sectoral positioning supports its consistent dividend payments.
| Metric | Value |
|---|---|
| Sector | Infrastructure Software |
| Dividend yield | 0.70 % |
| Current dividend per share | 2.12 USD |
| Dividend history | 16 years |
| Last cut or suspension | None |
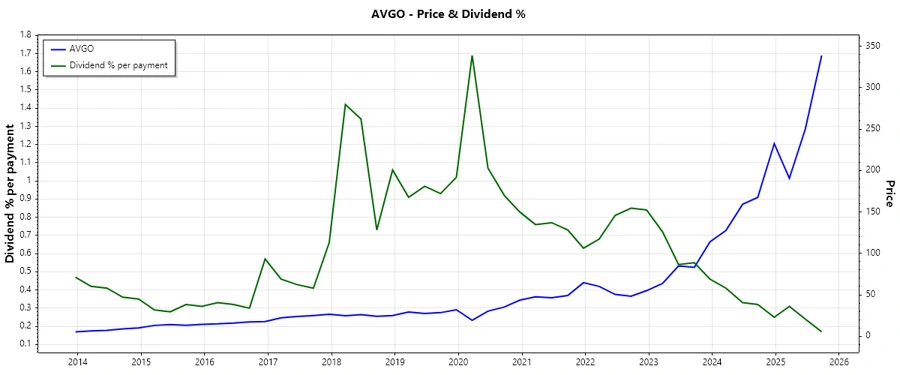
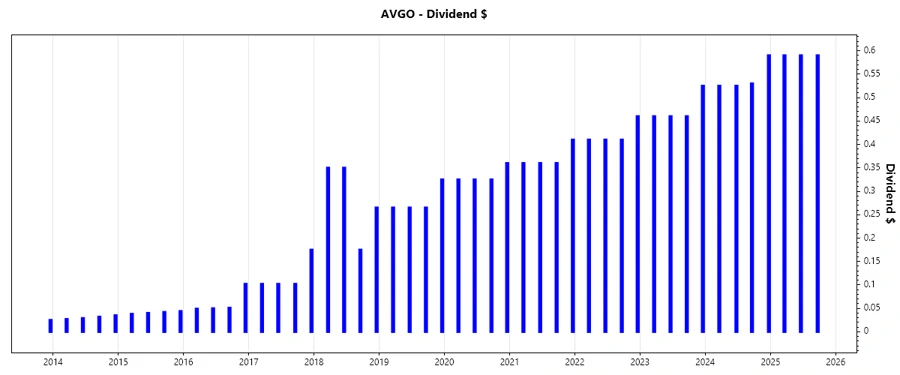
📉 Dividend History
The dividend history of Broadcom underscores steady and reliable payouts, crucial for those relying on dividend income. The company has maintained its dividend distributions throughout market fluctuations, reflecting financial resilience and a commitment to shareholder returns.
| Year | Dividend per Share (USD) |
|---|---|
| 2025 | 1.77 |
| 2024 | 2.17 |
| 2023 | 1.91 |
| 2022 | 1.69 |
| 2021 | 1.49 |
📈 Dividend Growth
Analyzing the dividend growth provides insight into Broadcom's future potential as a lucrative investment. The average dividend growth is 14.14% over 5 years, indicating a moderate but steady enhancement in shareholder returns.
| Time | Growth |
|---|---|
| 3 years | 13.35 % |
| 5 years | 14.14 % |
The average dividend growth of 14.14% over 5 years signifies a compelling trend of consistent return enhancement, making Broadcom an attractive option for dividend-growth investors.
✅ Payout Ratio
The payout ratio is a crucial indicator of dividend sustainability. Broadcom’s ratios provide a reassuring picture of dividend consistency and capacity to support potential increases.
| Key Figure | Ratio |
|---|---|
| EPS-based | 52.85 % |
| Free cash flow-based | 40.00 % |
With a 52.85% EPS payout ratio and a 40.00% free cash flow payout ratio, Broadcom maintains a balanced approach to dividend payments, ensuring consistently reliable shareholder payouts.
Cashflow & Capital Efficiency
Cashflow metrics are vital for assessing a company's operational efficiency and sustainability. Broadcom's cashflow figures highlight its financial health and potential for reinvestment or shareholder distributions.
| Year | 2024 | 2023 | 2022 |
|---|---|---|---|
| Free Cash Flow Yield | 2.49 % | 5.05 % | 8.48 % |
| Earnings Yield | 0.76 % | 4.03 % | 5.98 % |
| CAPEX to Operating Cash Flow | 2.75 % | 2.50 % | 2.53 % |
| Stock-based Compensation to Revenue | 11.13 % | 6.06 % | 4.62 % |
| Free Cash Flow / Operating Cash Flow Ratio | 97.25 % | 97.50 % | 97.47 % |
The data implies robust cash generation and management capacity at Broadcom, revealing its ability to sustain operations and growth-oriented strategies, key aspects of capital efficiency.
Balance Sheet & Leverage Analysis
A comprehensive analysis of a company's balance sheet ratios indicates its leverage and financial robustness, crucial for assessing long-term investment viability.
| Year | 2024 | 2023 | 2022 |
|---|---|---|---|
| Debt-to-Equity | 99.83 % | 165.28 % | 176.04 % |
| Debt-to-Assets | 40.79 % | 54.42 % | 54.58 % |
| Debt-to-Capital | 49.96 % | 62.30 % | 63.77 % |
| Net Debt to EBITDA | 2.44 | 1.24 | 1.44 |
| Current Ratio | 1.17 | 2.82 | 2.62 |
| Quick Ratio | 1.07 | 2.56 | 2.35 |
Broadcom displays financial stability with a balanced capital structure, reflected in its manageable leverage ratios and strong liquidity positions, signaling commendable financial health.
Fundamental Strength & Profitability
In measuring a company's fundamental strength, profitability margins and returns play a pivotal role, aligning with Broadcom's ability to generate meaningful profit from its resources.
| Year | 2024 | 2023 | 2022 |
|---|---|---|---|
| Return on Equity | 8.71 % | 58.70 % | 50.62 % |
| Return on Assets | 3.56 % | 19.33 % | 15.69 % |
| Margins: Net | 11.43 % | 39.31 % | 34.62 % |
| EBIT | 26.89 % | 46.68 % | 42.68 % |
| EBITDA | 46.30 % | 57.38 % | 57.69 % |
| Gross | 63.03 % | 68.93 % | 66.55 % |
| Research & Development to Revenue | 18.05 % | 14.67 % | 14.81 % |
These metrics underline Broadcom's profitability prowess, reflecting its strong operational foundations and effective resource utilization, which is essential for sustained long-term returns.
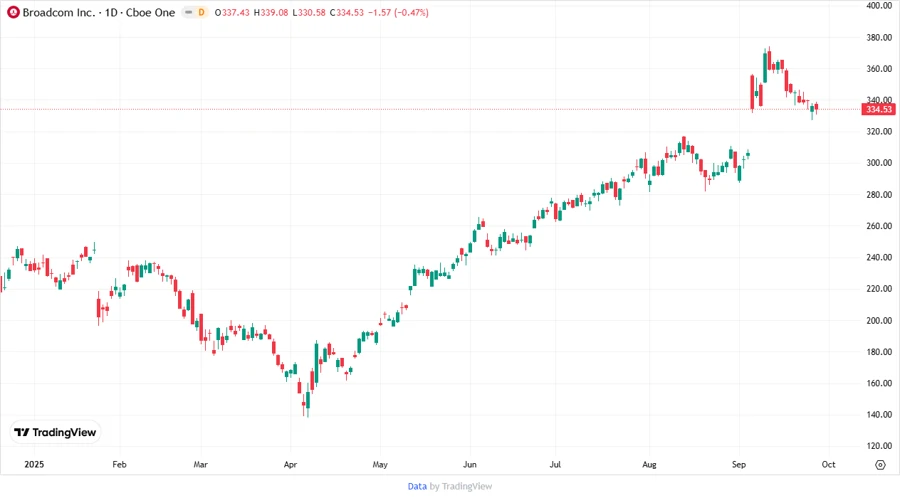
Price Development
Dividend Scoring System
| Category | Rating | Score |
|---|---|---|
| Dividend Yield | 3 | |
| Dividend Stability | 5 | |
| Dividend Growth | 4 | |
| Payout Ratio | 4 | |
| Financial Stability | 5 | |
| Dividend Continuity | 5 | |
| Cashflow Coverage | 4 | |
| Balance Sheet Quality | 5 |
Overall Score: 35/40
Rating
Broadcom Inc. showcases a strong commitment to turning profits into shareholder returns. With a stable history of dividend payments, robust financial metrics, and substantial growth potential, Broadcom earns a commendable rating. Investors seeking consistent dividends with growth potential may find Broadcom a valuable addition to their portfolios, although the modest current yield suggests supplementing income with growth expectations.