July 22, 2025 a 07:46 am


AVGO: Dividend Analysis - Broadcom Inc.
Broadcom Inc. demonstrates a solid dividend history, making it an attractive option for income-focused investors. The company's remarkable track record of consistent dividend payments and sustainable payout ratios positions it as a stable choice within the semiconductor sector. However, potential investors should consider the current dividend yield and payout ratios to assess long-term viability.
📊 Overview
Understanding Broadcom Inc.'s dividend profile helps investors evaluate its attractiveness in terms of income generation and potential growth over time.
| Metric | Value |
|---|---|
| Sector | Technology - Semiconductors |
| Dividend yield | 0.92% |
| Current dividend per share | 2.12 USD |
| Dividend history | 16 years |
| Last cut or suspension | None |
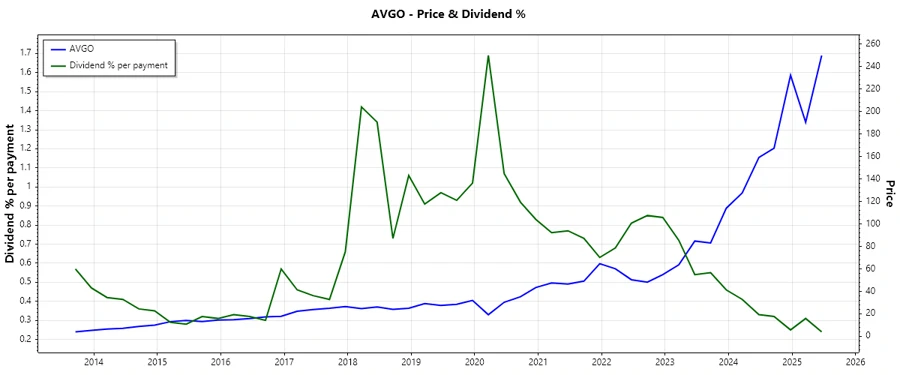
🗣️ Dividend History
Broadcom's consistent dividend payments underscore its commitment to returning value to shareholders. The historical stability is a significant positive indicator for potential and current investors.
| Year | Dividend per Share (USD) |
|---|---|
| 2025 | 1.18 |
| 2024 | 2.17 |
| 2023 | 1.91 |
| 2022 | 1.69 |
| 2021 | 1.49 |
📈 Dividend Growth
The growth in dividends over the years shows Broadcom's capacity to enhance shareholder value. Steady growth demonstrates strong financial performance and a promising long-term outlook.
| Time | Growth |
|---|---|
| 3 years | 13.35% |
| 5 years | 14.14% |
The average dividend growth is 14.14% over 5 years. This shows moderate but steady dividend growth.
⚠️ Payout Ratio
Payout ratios give insight into how sustainable a company's dividend payments are. A lower payout ratio suggests a robust ability to maintain dividends, even during cash flow fluctuations.
| Metric | Ratio |
|---|---|
| EPS-based | 77.34% |
| Free cash flow-based | 43.98% |
An EPS-based payout ratio of 77.34% is relatively high, indicating that a large portion of earnings is being distributed as dividends. However, a free cash flow payout ratio of 43.98% suggests dividends are well-covered, providing a buffer against future volatility.
✅ Cashflow & Capital Efficiency
Cash flow and capital efficiency metrics are crucial in assessing a company's operational health and its ability to sustain financial commitments such as dividend payments.
| Year | 2024 | 2023 | 2022 |
|---|---|---|---|
| Free Cash Flow Yield | 2.49% | 5.05% | 8.48% |
| Earnings Yield | 0.76% | 4.03% | 5.98% |
| CAPEX to Operating Cash Flow | 2.31% | 2.50% | 2.53% |
| Stock-based Compensation to Revenue | 11.13% | 6.06% | 4.62% |
| Free Cash Flow / Operating Cash Flow Ratio | 97.25% | 97.50% | 97.47% |
The consistent free cash flow and improved capital efficiency ratios demonstrate Broadcom's prudent financial management and strong investment in future growth prospects.
📉 Balance Sheet & Leverage Analysis
A strong balance sheet underpins future growth prospects and financial stability, pivotal for sustaining positive dividend actions.
| Year | 2024 | 2023 | 2022 |
|---|---|---|---|
| Debt-to-Equity | 0.998 | 1.653 | 1.760 |
| Debt-to-Assets | 0.408 | 0.544 | 0.546 |
| Debt-to-Capital | 0.500 | 0.623 | 0.638 |
| Net Debt to EBITDA | 2.438 | 1.239 | 1.439 |
| Current Ratio | 1.174 | 2.815 | 2.624 |
| Quick Ratio | 1.068 | 2.559 | 2.351 |
| Financial Leverage | 2.448 | 3.037 | 3.226 |
While leverage ratios indicate moderate debt levels, Broadcom's financial structure is well-positioned to leverage growth opportunities without jeopardizing liquidity.
🔍 Fundamental Strength & Profitability
Examining fundamental and profitability metrics provides insight into financial health and potential for long-term growth.
| Year | 2024 | 2023 | 2022 |
|---|---|---|---|
| Return on Equity | 8.71% | 58.70% | 50.62% |
| Return on Assets | 3.56% | 19.33% | 15.69% |
| Net Margin | 11.43% | 39.31% | 34.62% |
| EBIT Margin | 26.89% | 46.68% | 42.68% |
| EBITDA Margin | 46.30% | 57.38% | 57.69% |
| Gross Margin | 63.03% | 68.93% | 66.55% |
| Research & Development to Revenue | 18.05% | 14.67% | 14.81% |
Broadcom's solid profitability ratios underscore its efficiency in generating revenue and managing expenses. The impressive margins indicate strong operational performance.
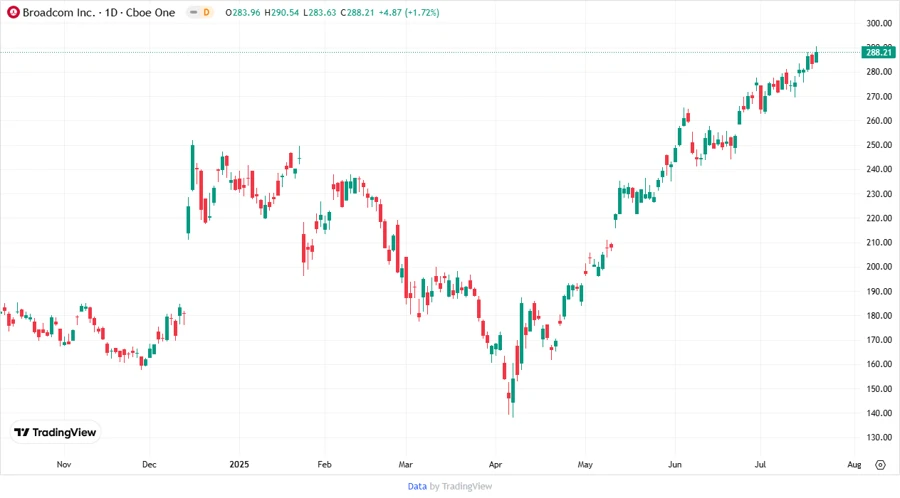
📈 Price Development
📊 Dividend Scoring System
| Criterion | Score | Performance |
|---|---|---|
| Dividend yield | 2 | |
| Dividend Stability | 5 | |
| Dividend growth | 4 | |
| Payout ratio | 3 | |
| Financial stability | 4 | |
| Dividend continuity | 5 | |
| Cashflow Coverage | 4 | |
| Balance Sheet Quality | 3 |
Total Score: 30/40
🏆 Rating
Overall, Broadcom Inc. exhibits a strong dividend profile with impressive stability and moderate growth. Given its consistent dividend history and substantial financial health, Broadcom stands as a promising investment for dividend-seeking investors, albeit with a slightly lower yield that warrants consideration alongside the company's robust earnings and capital efficiency.
Smart Data Insight
Master the Perfect Entry & Exit for this Stock
Don't leave your profits to chance. Historically, this stock follows specific seasonal patterns that institutional traders use to maximize returns.
- ✅ Identify the "Golden Buying Window"
- ✅ Avoid high-risk correction cycles
- ✅ Backtested data from the last 20+ years