May 21, 2026 a 08:15 am

AVB: Trend and Support & Resistance Analysis - AvalonBay Communities, Inc.
AvalonBay Communities, Inc. (AVB), a leader in the real estate investment trust (REIT) sector, manages a diverse range of apartment communities across major metropolitan areas. Recently, the stock has shown fluctuations, which provides opportunities for technical analysis to identify potential trading areas. This analysis identifies the trend and key support and resistance levels to provide a comprehensive outlook on AVB's stock performance.
Trend Analysis
| Date | Close Price | Trend |
|---|---|---|
| 2026-05-20 | 186.69 | ▲ |
| 2026-05-19 | 185.11 | ▼ |
| 2026-05-18 | 185.25 | ⚖️ |
| 2026-05-15 | 180.84 | ▼ |
| 2026-05-14 | 183.54 | ▲ |
| 2026-05-13 | 186.46 | ▲ |
| 2026-05-12 | 187.02 | ▲ |
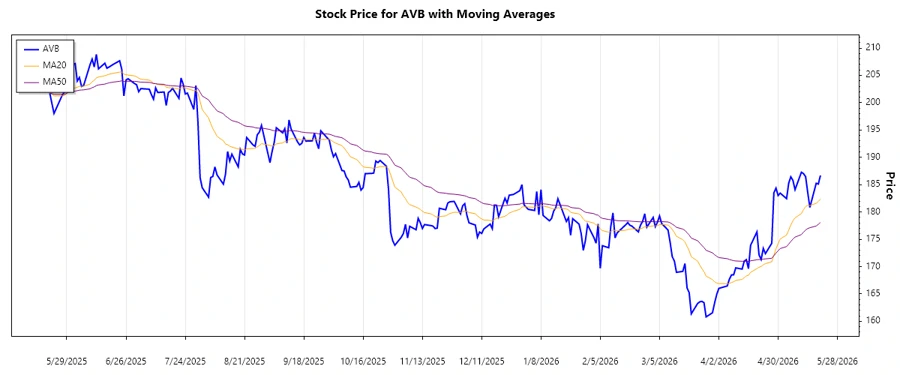
The analysis over the recent week reflects a predominantly upward trend, as indicated by EMA calculations where EMA20 has persistently been above EMA50, affirming a short-term bullish momentum.
Support and Resistance
| Zone Type | From | To | Status |
|---|---|---|---|
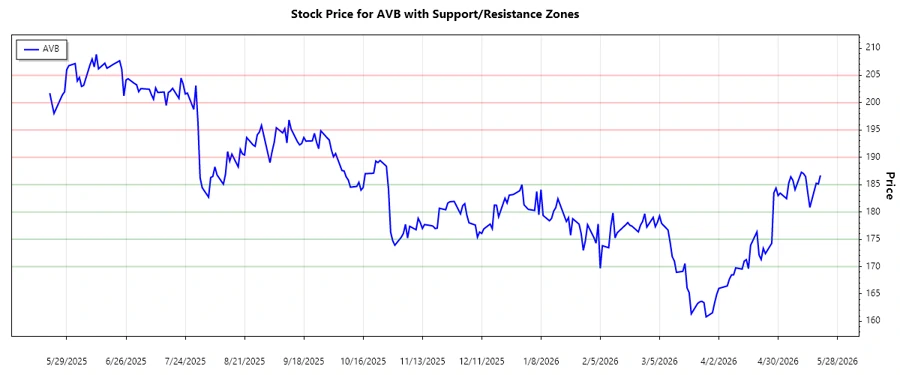
| Support Zone 1 | 170.00 | 175.00 | ▼ |
| Support Zone 2 | 180.00 | 185.00 | ▼ |
| Resistance Zone 1 | 190.00 | 195.00 | ▲ |
| Resistance Zone 2 | 200.00 | 205.00 | ▲ |
The current stock price of around 186.69 suggests it is nearing the lower range of a resistance zone, potentially exerting upward pressure if it breaches the 190 mark, reinforcing bullish sentiments.
Conclusion
The analysis of AvalonBay Communities, Inc.'s stock suggests a prevailing bullish trend supported by technical indicators like the EMA20 being above EMA50. While the stock is approaching a critical resistance zone, which could imply potential for further upward momentum, investors must be wary of market corrections. Overall, AVB's strong foothold in REITs makes it an attractive prospect amidst economic fluctuations, but vigilance is advised given market volatility.
Smart Data Insight
Master the Perfect Entry & Exit for this Stock
Don't leave your profits to chance. Historically, this stock follows specific seasonal patterns that institutional traders use to maximize returns.
- ✅ Identify the "Golden Buying Window"
- ✅ Avoid high-risk correction cycles
- ✅ Backtested data from the last 20+ years