October 27, 2025 a 02:03 pm
AVB: Trend and Support & Resistance Analysis - AvalonBay Communities, Inc.
AvalonBay Communities, Inc. (NYSE: AVB) operates as a renowned equity REIT focusing on the development and management of apartment communities across key metropolitan areas in the United States. The last few months have witnessed fluctuations in stock price, reflecting broader market conditions and specific industry pressures. Careful analysis of the stock's technical indicators, such as EMAs, provides insights into potential future performance. This analysis aims to provide a detailed examination of the stock's trend and crucial support and resistance levels, aiding in informed investment decisions.
Trend Analysis
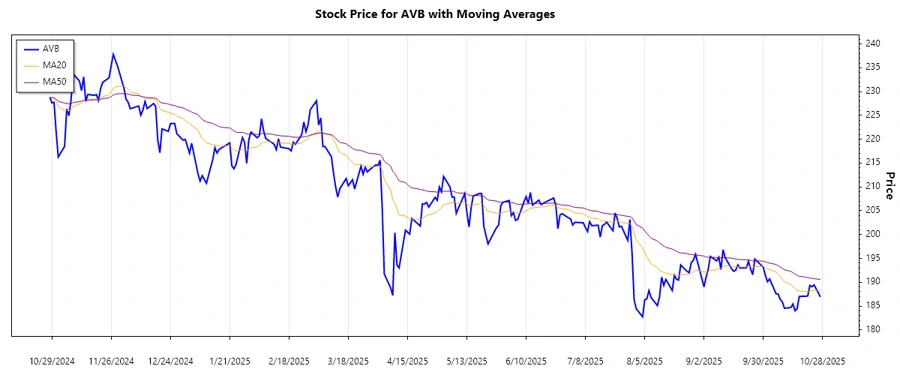
The technical analysis of AvalonBay Communities, Inc. (AVB) shows a clear trend over the last months. Calculating the 20-day and 50-day EMAs from the closing prices suggests a potential directional movement in the stock's value. With the recent data of the EMAs, we can observe:
| Date | Close Price | Trend |
|---|---|---|
| 2025-10-27 | 186.90 | ▼ Abwärtstrend |
| 2025-10-24 | 189.43 | ▼ Abwärtstrend |
| 2025-10-23 | 189.04 | ▼ Abwärtstrend |
| 2025-10-22 | 189.32 | ▼ Abwärtstrend |
| 2025-10-21 | 187.12 | ▼ Abwärtstrend |
| 2025-10-20 | 187.05 | ▼ Abwärtstrend |
| 2025-10-17 | 187.02 | ▼ Abwärtstrend |
The current technical indicators suggest a persistent downward trend. Considering that the EMA20 is consistently below the EMA50, the stock is demonstrating a prolonged bearish sentiment. Investors should watch for any changes in volume and momentum that could signal a reversal or continuation.
Support- and Resistance
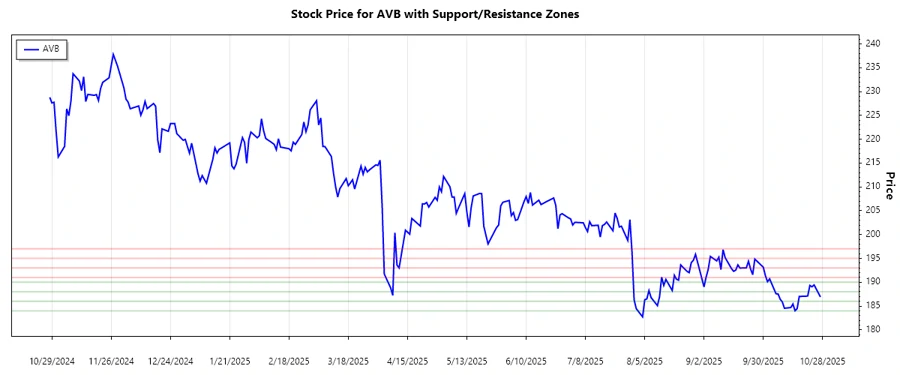
Identifying key support and resistance levels is crucial for potentially predicting the stock's price movements. Based on the historical data, the following crucial zones have been identified:
| Zone Type | From | To |
|---|---|---|
| Support | 184.00 | 186.00 |
| Support | 188.00 | 190.00 |
| Resistance | 191.00 | 193.00 |
| Resistance | 195.00 | 197.00 |
The stock is currently hovering near its lower support zone, indicating a potential bounce back or, if broken, a move towards the next support level. The resistance zones ahead will be significant hurdles that could dictate further upward movements once the downward trend slows down.
Conclusion
The analysis of AvalonBay Communities, Inc. suggests a bearish outlook in the short to medium term, primarily driven by the current downward trend in EMA indicators. The stock is nearing or within critical support zones, which could serve as potential pivot points for price recovery. Market participants should remain vigilant for any signals of trend reversal. However, if the support zones are breached, further downside risks are anticipated. On the upside, overcoming resistance zones is key for any substantial bullish recovery. Investors should weigh both potential opportunities for gains and risks of further drops in accordance with broader market dynamics and company-specific news.
Smart Data Insight
Master the Perfect Entry & Exit for this Stock
Don't leave your profits to chance. Historically, this stock follows specific seasonal patterns that institutional traders use to maximize returns.
- ✅ Identify the "Golden Buying Window"
- ✅ Avoid high-risk correction cycles
- ✅ Backtested data from the last 20+ years