
June 16, 2026 a 05:15 am

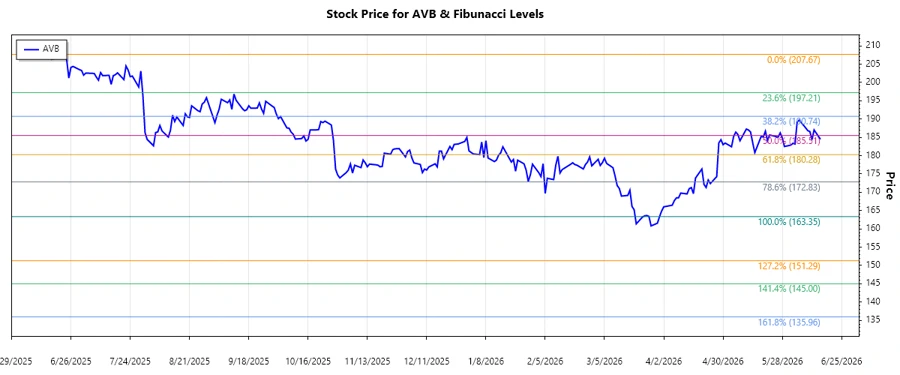
AVB: Fibonacci Analysis - AvalonBay Communities, Inc.
AvalonBay Communities, Inc. (AVB) has shown varied performance over recent months. The stock's recent data indicates a potential downtrend, with price levels reflecting significant movements and retracements. As an equity REIT, its focus on high-demand metropolitan areas continues to bolster its real estate portfolio, providing resilience against broader market fluctuations. However, the current trend suggests careful analysis of support levels is warranted.
Fibonacci Analysis
The AVB stock has exhibited a downtrend in the recent analysis. The data analyzed from 2025-06-16 to 2026-06-15 shows the following key points:
| Detail | Value |
|---|---|
| Start Date | 2025-06-16 |
| End Date | 2026-06-15 |
| High Price and Date | $207.67 on 2025-06-23 |
| Low Price and Date | $163.35 on 2026-03-31 |
Based on these points, the following Fibonacci retracement levels have been calculated:
| Fibonacci Level | Price Level |
|---|---|
| 0.236 | $179.69 |
| 0.382 | $187.27 |
| 0.5 | $193.51 |
| 0.618 | $199.75 |
| 0.786 | $208.26 |
The current price is $184.48, placing it within the 0.236 to 0.382 retracement zone. This suggests that the current level is closer to the beginning of the Fibonacci retracement levels, indicating a possible consolidation area before a potential reversal or continuation of the downtrend. Should the price move above the 0.382 level, it may signal a shift towards a stronger upside correction.
Conclusion
AvalonBay Communities, Inc.'s current trading situation presents both challenges and opportunities. The stock is stabilizing within a significant retracement zone, suggesting a period of consolidation. This can offer a potential entry point for investors seeking to capitalize on future rebounds, especially given AvalonBay's solid fundamentals and strategic market presence. Nonetheless, the stock remains vulnerable to downside risks if broader market conditions or interest rates adversely affect real estate valuations. Continual monitoring of technical levels and market sentiment is crucial for informed decision-making.
Smart Data Insight
Master the Perfect Entry & Exit for this Stock
Don't leave your profits to chance. Historically, this stock follows specific seasonal patterns that institutional traders use to maximize returns.
- ✅ Identify the "Golden Buying Window"
- ✅ Avoid high-risk correction cycles
- ✅ Backtested data from the last 20+ years