March 21, 2026 a 04:44 pm

AVB: Fibonacci Analysis - AvalonBay Communities, Inc.
AvalonBay Communities, Inc. (AVB) is a prominent player in the real estate investment trust (REIT) sector, specializing in apartment communities across major metropolitan areas. The company's stock is currently experiencing a significant downward trend, making it a subject of interest for technical analysis. Understanding the Fibonacci levels could provide insights into potential future price movements. Investors should be mindful of overall market conditions and the real estate industry's performance when considering AVB stock.
Fibonacci Analysis
| Analysis Period | High (Price/Date) | Low (Price/Date) |
|---|---|---|
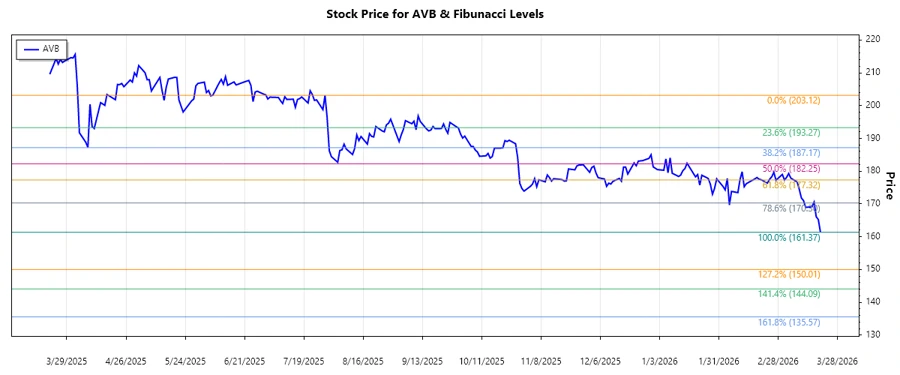
| 2025-07-29 to 2026-03-20 | $203.12 / 2025-07-29 | $161.37 / 2026-03-20 |
| Fibonacci Level | Price Level |
|---|---|
| 0.236 | $171.26 |
| 0.382 | $178.17 |
| 0.5 | $182.25 |
| 0.618 | $186.33 |
| 0.786 | $192.21 |
The current price is within the 0.236 retracement level, indicating a minor recovery phase. Technically, this level could offer resistance, hindering further upward movement until stronger momentum is achieved.
Conclusion
The AvalonBay Communities, Inc. (AVB) stock has faced a downward trend from its high of $203.12 in July 2025 to a low of $161.37 in March 2026. The analysis indicates that the stock is currently in the early stages of a retracement phase, struggling to break through the 0.236 Fibonacci level. This resistance level may inhibit immediate upward movement, but it could also signal a potential foundation for future growth if the stock gains enough bullish momentum. Investors should consider the risks associated with market volatility and sector-specific conditions. A sustained breach of lower Fibonacci levels could highlight further downside risk, while a breakout above resistance levels may offer new opportunities.