
May 31, 2026 a 11:30 am

AVB: Dividend Analysis - AvalonBay Communities, Inc.
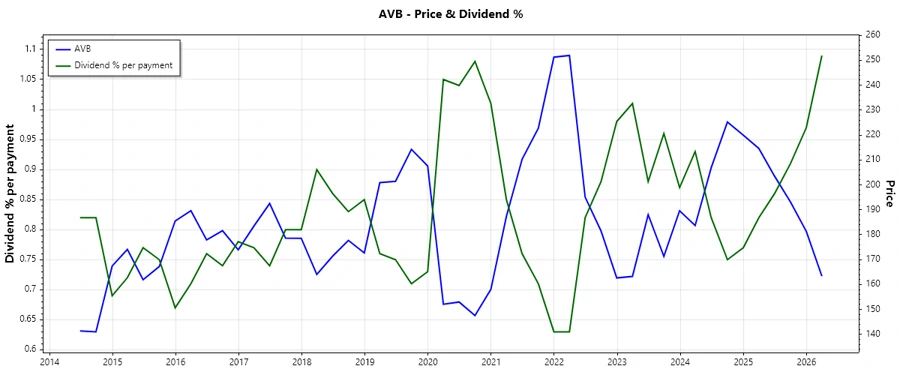
AvalonBay Communities, Inc. has demonstrated a strong dividend profile, characterized by a stable and consistent dividend history. The real estate sector's dynamics support its appealing dividend yield, making AVB attractive for income-focused investors. However, the comparatively high payout ratios warrant careful monitoring to ensure long-term sustainability.
📊 Overview
AvalonBay Communities, Inc. operates in the Real Estate sector, showcasing a commendable dividend profile. The current dividend yield stands at 4.30%, bolstered by a dividend per share figure of $7.05. With 33 years of dividend history, the company has shown remarkable consistency, and there is no recent record of dividend cuts or suspensions.
| Parameter | Data |
|---|---|
| Sector | Real Estate |
| Dividend Yield | 4.30 % |
| Current Dividend Per Share | 7.05 USD |
| Dividend History | 33 years |
| Last Cut or Suspension | None |
🗣️ Dividend History
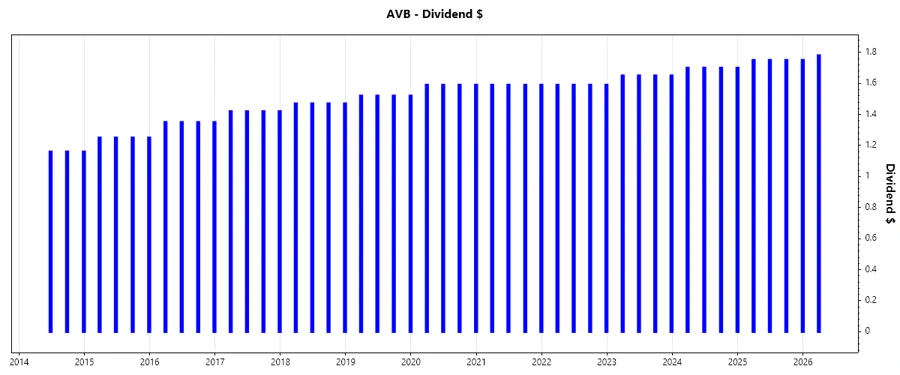
AvalonBay has maintained a steady track of dividends over the years. This is crucial for investors seeking reliable income streams. The company's ability to sustain and gradually increase dividends over decades underscores its financial solidity and commitment to shareholders.
| Year | Dividend Per Share (USD) |
|---|---|
| 2026 | 1.78 |
| 2025 | 7.00 |
| 2024 | 6.80 |
| 2023 | 6.60 |
| 2022 | 6.36 |
📈 Dividend Growth
Understanding AVB’s dividend growth rate is vital to forecast potential income increases. Over the past three years, the dividend growth rate was 3.25%, while over five years it grew by 1.94%, indicating a modest but consistent uptick in dividend payouts.
| Time | Growth |
|---|---|
| 3 years | 3.25 % |
| 5 years | 1.94 % |
The average dividend growth is 1.94% over 5 years. This shows moderate but steady dividend growth, making AVB a potentially reliable investment for long-term income seekers.
📉 Payout Ratio
The payout ratio is a critical metric for dividend sustainability. The EPS-based payout ratio is 86.30%, and the free cash flow-based ratio is 65.21%. These figures suggest a high proportion of earnings are distributed as dividends, signifying potential vulnerability to earnings fluctuations.
| Key Figure | Ratio |
|---|---|
| EPS-based | 86.30 % |
| Free cash flow-based | 65.21 % |
The elevated EPS payout ratio indicates a reliance on profitable operations for dividend coverage, while the FCF ratio suggests more comfortable coverage, but care should be taken as market conditions evolve.
✅ Cashflow & Capital Efficiency
Analyzing cash flow yields and capital efficiency ratios offers profound insights into the business's operational and financial health. These metrics influence the company's capacity to maintain and grow dividends.
| Metric | 2025 | 2024 | 2023 |
|---|---|---|---|
| Free Cash Flow Yield | 5.54% | 4.51% | 5.15% |
| Earnings Yield | 4.12% | 3.46% | 3.51% |
| CAPEX to Operating Cash Flow | 15.78% | 12.32% | 12.65% |
| Stock-based Compensation to Revenue | 0.87% | 0.87% | 0.98% |
| Free Cash Flow / Operating Cash Flow Ratio | 84.22% | 87.68% | 87.35% |
| Return on Invested Capital | 4.28% | 4.52% | 4.39% |
The company exhibits robust cash flow metrics and capital efficiency. High free cash flow yield and stable operating cash flow ratios underpin its ability to sustain dividends. However, vigilant monitoring of CAPEX trends is advisable to ensure continued cash flow robustness.
⚠️ Balance Sheet & Leverage Analysis
Balance sheet analysis focuses on leverage levels, liquidity, and overall financial stability. These elements are crucial for maintaining dividend payments during economic downturns.
| Metric | 2025 | 2024 | 2023 |
|---|---|---|---|
| Debt-to-Equity | 0.80 | 0.69 | 0.69 |
| Debt-to-Assets | 0.42 | 0.39 | 0.39 |
| Debt-to-Capital | 0.45 | 0.41 | 0.41 |
| Net Debt to EBITDA | 4.64 | 3.78 | 3.94 |
| Current Ratio | 0.35 | 0.36 | 0.76 |
| Quick Ratio | 0.25 | 0.36 | 0.76 |
| Financial Leverage | 1.91 | 1.76 | 1.75 |
AVB's leverage ratios suggest prudent use of debt with satisfactory liquidity ratios. The net debt-to-EBITDA ratio reflects manageable leverage levels, though further reduction would enhance financial security, particularly during volatile markets.
🔍 Fundamental Strength & Profitability
Key performance indicators illuminate profitability and operational efficiency, critical for evaluating a company's ability to generate returns and uphold dividends.
| Metric | 2025 | 2024 | 2023 |
|---|---|---|---|
| Return on Equity | 9.06% | 9.06% | 7.88% |
| Return on Assets | 4.74% | 5.15% | 4.49% |
| Margins: Net | 34.64% | 37.13% | 33.56% |
| Margins: EBIT | 43.26% | 44.93% | 41.35% |
| Margins: EBITDA | 73.32% | 73.99% | 70.87% |
| Margins: Gross | 66.99% | 63.16% | 64.30% |
| Research & Development to Revenue | 0.00% | 0.00% | 0.00% |
AVB manifests competitive profitability metrics, demonstrated by substantial returns on equity and assets. Healthy margins reflect operational efficiency, essential for dividend viability.
📸 Price Development
📋 Dividend Scoring System
AVB's custom dividend scoring evaluates key dimensions to assess overall dividend prowess.
| Criterion | Score (1-5) | Score Bar |
|---|---|---|
| Dividend yield | 4 | |
| Dividend Stability | 5 | |
| Dividend Growth | 3 | |
| Payout ratio | 3 | |
| Financial Stability | 4 | |
| Dividend Continuity | 5 | |
| Cashflow Coverage | 4 | |
| Balance Sheet Quality | 4 |
Total Dividend Score: 32/40
🔍 Rating
AvalonBay Communities, Inc. delivers a robust dividend profile, recommended for investors seeking stable income within the real estate sector. However, the elevated payout ratio necessitates vigilance relative to earnings sustainability. Overall, AVB advocates a promising outlook with room for capital appreciation.
Smart Data Insight
Master the Perfect Entry & Exit for this Stock
Don't leave your profits to chance. Historically, this stock follows specific seasonal patterns that institutional traders use to maximize returns.
- ✅ Identify the "Golden Buying Window"
- ✅ Avoid high-risk correction cycles
- ✅ Backtested data from the last 20+ years