January 17, 2026 a 03:31 pm


AVB: Dividend Analysis - AvalonBay Communities, Inc.
AvalonBay Communities, Inc. represents a robust entity in the real estate sector with a desirable dividend track record. Its commitment to maintaining dividends even during economic downturns highlights its resilience. Investors looking for a stable yield in a fluctuating market may find this stock attractive.
📊 Overview
AvalonBay Communities, Inc. operates in the Real Estate sector, delivering a notable dividend yield of 3.86%. With a current dividend per share positioned at 6.77 USD and a continuous dividend history of 32 years without a cut since 2009, its track record demonstrates reliability.
| Parameter | Value |
|---|---|
| Sector | Real Estate |
| Dividend yield | 3.86 % |
| Current dividend per share | 6.77 USD |
| Dividend history | 32 years |
| Last cut or suspension | 2009 |
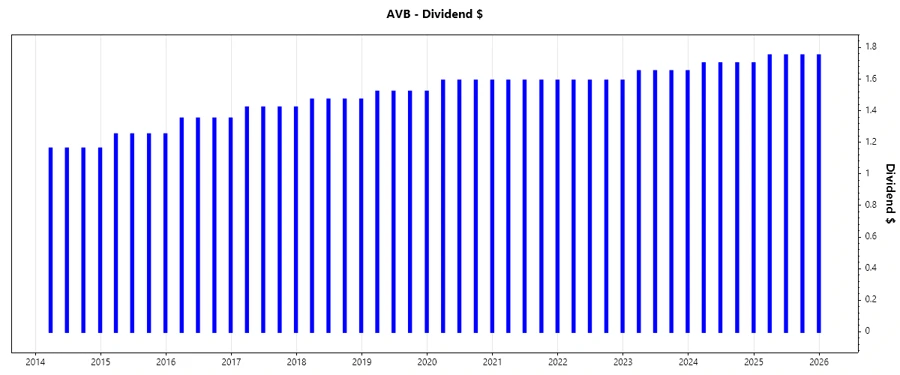
📈 Dividend History
The dividend history is crucial as it shows consistency and management's commitment to return cash to shareholders. Below is a view of the recent dividend payments which reveal consistent growth.
| Year | Dividend per Share (USD) |
|---|---|
| 2025 | 7.00 |
| 2024 | 6.80 |
| 2023 | 6.60 |
| 2022 | 6.36 |
| 2021 | 6.36 |
📈 Dividend Growth
The dividend growth rate serves as an indicator of the potential for long-term income increase for investors. AvalonBay's growth over recent years suggests steady upward trends suitable for dividend growth investors.
| Time | Growth |
|---|---|
| 3 years | 3.25 % |
| 5 years | 1.94 % |
The average dividend growth is 1.94% over 5 years. This shows moderate but steady dividend growth valuable for risk-averse investors.
⚖️ Payout Ratio
Payout ratios reflect the proportion of earnings paid out as dividends, and they are essential for assessing sustainability. A high EPS-based payout ratio may suggest dividends at risk if profits decline, while a moderate free cash flow payout indicates sustainable dividends.
| Key figure | Ratio |
|---|---|
| EPS-based | 82.52 % |
| Free cash flow-based | 62.53 % |
The EPS payout ratio of 82.52% might present a potential risk if earnings shrink, yet the FCF payout is more comfortable at 62.53%.
🔍 Cashflow & Capital Efficiency
Cash flow metrics provide insights into a company's capacity to sustain dividends through its operations rather than debt. A stable cash flow reflects well on dividend connectivity and confidence in capital efficiency.
| Metric | 2024 | 2023 | 2022 |
|---|---|---|---|
| Free Cash Flow Yield | 4.51 % | 5.15 % | 5.53 % |
| Earnings Yield | 3.46 % | 3.51 % | 5.04 % |
| CAPEX to Operating Cash Flow | 12.32 % | 12.65 % | 12.29 % |
| Stock-based Compensation to Revenue | 0.87 % | 0.98 % | 1.31 % |
| Free Cash Flow / Operating Cash Flow Ratio | 87.68 % | 87.35 % | 87.71 % |
The free cash flow yield decline highlights a challenge, although operational cash flows remain robust. Capital allocation strategy is effective with satisfactory returns on investments.
⚠️ Balance Sheet & Leverage Analysis
A balance sheet evaluation provides insights into financial stability and leverage level, crucial for assessing a company's risk profile and dividend safety.
| Metric | 2024 | 2023 | 2022 |
|---|---|---|---|
| Debt-to-Equity | 69.09 % | 69.04 % | 75.34 % |
| Debt-to-Assets | 39.29 % | 39.34 % | 41.44 % |
| Debt-to-Capital | 40.86 % | 40.84 % | 42.97 % |
| Net Debt to EBITDA | 3.78x | 3.94x | 3.58x |
| Current Ratio | 0.36 | 0.76 | 1.11 |
| Quick Ratio | 0.36 | 0.76 | 1.11 |
| Financial Leverage | 1.76x | 1.75x | 1.82x |
While the leverage ratios reveal moderate leverage, the decrease since last year suggests improving financial stability. The liquidity position is strong enough to manage current obligations.
📉 Fundamental Strength & Profitability
An analysis of profitability metrics offers insights into a company's efficiency in generating earnings relative to sales, equity, and other costs, integral for long-term sustainability.
| Metric | 2024 | 2023 | 2022 |
|---|---|---|---|
| Return on Equity | 9.06 % | 7.88 % | 10.10 % |
| Return on Assets | 5.15 % | 4.49 % | 5.56 % |
| Net Margin | 37.13 % | 33.56 % | 43.83 % |
| EBIT Margin | 44.93 % | 41.35 % | 53.26 % |
| EBITDA Margin | 73.99 % | 70.87 % | 84.68 % |
| Gross Margin | 63.16 % | 64.30 % | 64.56 % |
| R&D to Revenue | 0 % | 0 % | 0.64 % |
While key profitability margins have decreased, they remain industry-competitive, providing positive financial security for investors seeking income stability.
📊 Price Development
🔍 Dividend Scoring System
| Criteria | Details | Score |
|---|---|---|
| Dividend yield | 3.86 % | 3 |
| Dividend Stability | 32 years, last cut in 2009 | 4 |
| Dividend growth | 5yr 1.94 % | 3 |
| Payout ratio | 82.52 % EPS, 62.53 % FCF | 2 |
| Financial stability | Moderate leverage | 4 |
| Dividend continuity | Continuous for 32 years | 4 |
| Cashflow Coverage | FCF yield: 4.51 % | 3 |
| Balance Sheet Quality | Strong current and quick ratios | 4 |
Total Score: 27/40
✅ Rating
Overall, AvalonBay Communities, Inc. exhibits a robust dividend foundation underscored by extensive history and moderate growth. The existing payout ratios are relatively high, yet supported by consistent operational cash flows. Consequently, the recommendation is to consider this stock for portfolios prioritizing stable income.