September 09, 2025 a 07:32 am


AVB: Dividend Analysis - AvalonBay Communities, Inc.
🗣️ AvalonBay Communities, Inc. presents a stable dividend profile supported by its solid dividend yield and substantial dividend history years, though its dividend growth remains modest. Despite a relatively high payout ratio, the company showcases resilience in maintaining its dividend payouts, further indicating financial stability and shareholder value focus.
Overview
📊 AvalonBay Communities operates within the Real Estate sector, offering a dividend yield of 3.39%. With a current annual dividend per share of 6.77 USD, the company has consistently paid dividends for 32 years without any recent suspensions or cuts.
| Metric | Detail |
|---|---|
| Sector | Real Estate |
| Dividend Yield | 3.39% |
| Current Dividend per Share | 6.77 USD |
| Dividend History | 32 years |
| Last Cut or Suspension | None |
Dividend History
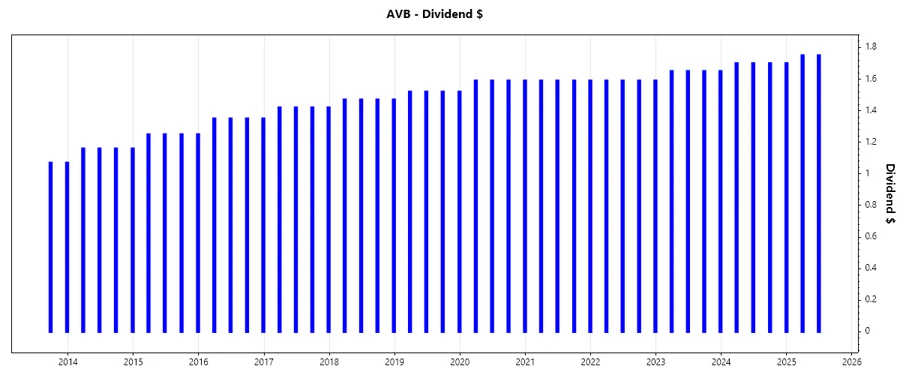
📉 AvalonBay’s dividend history showcases its capability to return value to shareholders steadily over decades. Continuity in dividends not only enhances shareholder trust but also signifies management's commitment to distributing profits consistently.
| Year | Dividend per Share (USD) |
|---|---|
| 2025 | 3.50 |
| 2024 | 6.8 |
| 2023 | 6.60 |
| 2022 | 6.36 |
| 2021 | 6.36 |
Dividend Growth
📈 Dividend growth indicates a company’s ability to enhance its shareholder returns over time. AvalonBay's growth at 2.25% in 3 years and 2.26% over 5 years reflects consistency but highlights potential limitations in substantial growth opportunities.
| Time | Growth |
|---|---|
| 3 years | 2.25% |
| 5 years | 2.26% |
The average dividend growth is 2.26% over 5 years. This shows moderate but steady dividend growth.
Payout Ratio
🧮 A payout ratio provides insights into the sustainability of dividends. With an EPS payout ratio of 83.05% and FCF payout of 69.55%, AvalonBay demonstrates a generous return policy to investors while maintaining a prudent buffer for future investments or potential downturns.
| Key Figure | Ratio |
|---|---|
| EPS-based | 83.05% |
| Free cash flow-based | 69.55% |
⚠️ The EPS payout ratio of 83.05% and FCF payout ratio of 69.55% indicate a strong dividend policy, though it suggests careful monitoring to avoid over-leverage of earnings.
Cashflow & Capital Efficiency
💸 Cashflow efficiency reveals organizational strength in generating liquidity. AvalonBay showcases stable free cash flow and sound investment returns, enhancing its ability to maintain operations and fund dividends sustainably.
| Metric | 2022 | 2023 | 2024 |
|---|---|---|---|
| Free Cash Flow Yield | 5.53% | 5.15% | 4.51% |
| Earnings Yield | 5.04% | 3.51% | 3.46% |
| CAPEX to Operating Cash Flow | 12.29% | 12.65% | 12.32% |
| Stock-based Compensation to Revenue | 1.31% | 0.98% | 0.87% |
| Free Cash Flow / Operating Cash Flow Ratio | 87.71% | 87.35% | 87.68% |
✅ The cash flow metrics suggest efficient capital utilization, with a highly favorable FCF yield and operating cash flow utilization, signaling financially sound practices.
Balance Sheet & Leverage Analysis
📚 Balance sheet strength is crucial for financial resilience. AvalonBay's leverage levels and liquidity ratios show a well-managed financial framework, supporting ongoing dividend policies.
| Metric | 2022 | 2023 | 2024 |
|---|---|---|---|
| Debt-to-Equity | 0.75 | 0.69 | 0.69 |
| Debt-to-Assets | 0.41 | 0.39 | 0.39 |
| Debt-to-Capital | 0.43 | 0.41 | 0.41 |
| Net Debt to EBITDA | 3.58 | 3.94 | 3.78 |
| Current Ratio | 1.11 | 0.76 | 0.36 |
| Quick Ratio | 1.11 | 0.76 | 0.36 |
| Financial Leverage | 1.82 | 1.75 | 1.76 |
⚠️ The data reflects a robust balance sheet with manageable leverage ratios, although the diminishing current and quick ratios warrant monitoring for future liquidity risks.
Fundamental Strength & Profitability
💹 AvalonBay's profitability metrics display robust margins and returns, highlighting effective operational strategies and potential for sustained growth and profitability.
| Metric | 2022 | 2023 | 2024 |
|---|---|---|---|
| Return on Equity | 10.10% | 7.88% | 9.06% |
| Return on Assets | 5.56% | 4.49% | 5.15% |
| Net Margin | 43.83% | 33.56% | 37.13% |
| EBIT Margin | 53.26% | 41.35% | 44.93% |
| EBITDA Margin | 84.68% | 70.87% | 73.99% |
| Gross Margin | 64.56% | 64.30% | 63.16% |
| R&D to Revenue | 0.00% | 0.00% | 0.00% |
✅ Overall, AvalonBay demonstrates commendable profitability and margin stability, underscoring effective management and operational alignment with shareholder value creation.
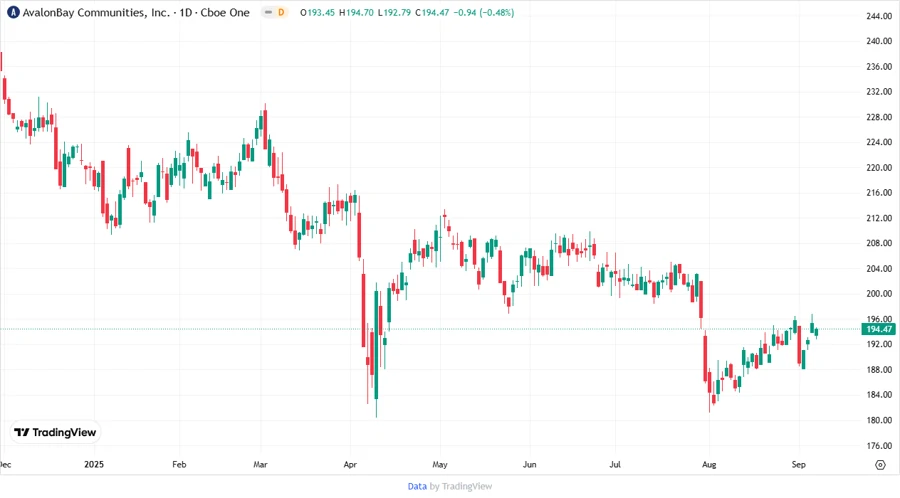
Price Development
Dividend Scoring System
| Category | Score | - |
|---|---|---|
| Dividend Yield | 4 | |
| Dividend Stability | 5 | |
| Dividend Growth | 3 | |
| Payout Ratio | 3 | |
| Financial Stability | 4 | |
| Dividend Continuity | 5 | |
| Cashflow Coverage | 4 | |
| Balance Sheet Quality | 4 |
Total Score: 32/40
Rating
✅ Overall, AvalonBay Communities, Inc. earns a robust rating due to its consistent dividend payments and sound financial management. Despite modest dividend growth, its reliable stability and financial strength offer a compelling choice for dividend-focused portfolios. The company displays a commitment to sustainable shareholder returns amidst maintaining a strategic balance of growth and payout.
Smart Data Insight
Master the Perfect Entry & Exit for this Stock
Don't leave your profits to chance. Historically, this stock follows specific seasonal patterns that institutional traders use to maximize returns.
- ✅ Identify the "Golden Buying Window"
- ✅ Avoid high-risk correction cycles
- ✅ Backtested data from the last 20+ years